Source page: McKinsey & Company
Commentary
These women experience the highest levels of workplace microaggressions
Diversity & Inclusion | Inequality
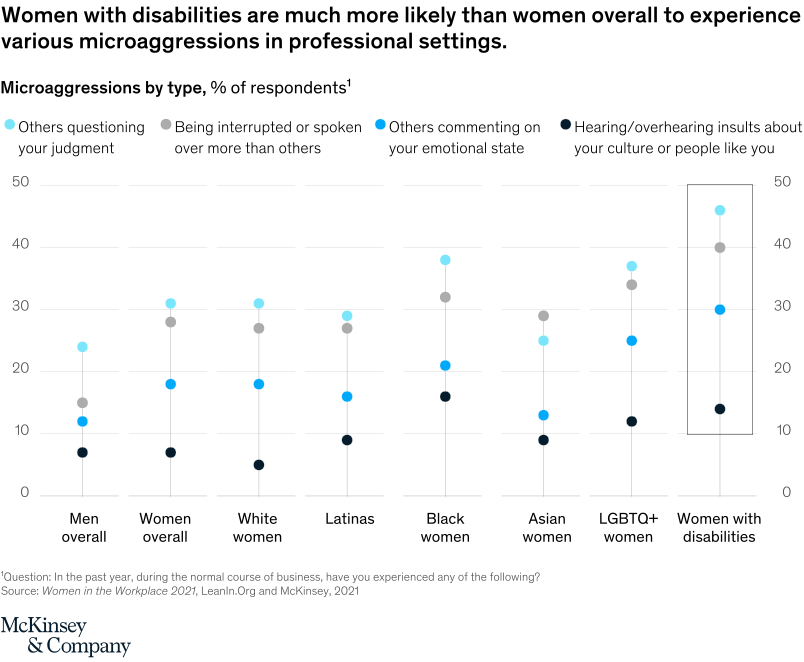
October 22, 2021 – Microaggressions—such having one’s judgment questioned—are more commonly experienced by women of color, women with disabilities, and LGBTQ+ women than men and women overall in professional settings. Forty percent of women with disabilities, for example, were interrupted or spoken over at work, compared with almost 15 percent of men overall, based on results of the latest Women in the Workplace study by McKinsey and LeanIn.Org.
To read the article, see “Women in the Workplace 2021,” September 27, 2021.
customizer here
Visual form
Multi-series dot comparison chart.
Layout / body structure
The chart is a single panel with eight respondent groups arranged left to right and four colored dots stacked vertically in each group. Reader compares the four microaggression types within each group and then scans across groups to see which populations sit highest on each measure.
What is being compared
The chart compares the share of respondents who experienced four kinds of microaggressions across different identity groups. It contrasts men overall, women overall, White women, Latinas, Black women, Asian women, LGBTQ+ women, and women with disabilities.
Measurement system
The vertical axis is measured in percent of respondents from 0 to 50. Each color corresponds to a different microaggression type: others questioning your judgment, being interrupted or spoken over more than others, others commenting on your emotional state, and hearing or overhearing insults about your culture or people like you.
Visible structure inside the graphic
Each group is shown as a vertical stack of four dots connected by a thin stem, making it easy to compare the relative ordering of the four microaggression types. Women with disabilities are boxed off on the far right and have the highest dot in every color family, while the lower left groups such as men overall sit much closer to the bottom of the scale.
Main takeaway from the visual
Women with disabilities experience the highest level of workplace microaggressions across all four types shown. The rightmost boxed group stands visibly above the rest of the chart, while other groups such as Black women and LGBTQ+ women also show elevated levels relative to women overall and men overall.
Key standout values or extremes
The highest visible readings belong to women with disabilities, with dots around 45 for questioning judgment, about 39 for being interrupted, about 29 for comments on emotional state, and about 14 for hearing insults about their culture or people like them. Men overall sit lowest across the chart, with dots near the low-to-mid 20s, teens, and single digits depending on the microaggression type.
Controls / sequence, when applicable
This is a static chart image with no in-chart controls to operate.
Companion media, when applicable
There is no separate companion audio or video; the chart image is the full visual on this page.