Source page: McKinsey & Company
Commentary
Too many oil tankers, too little demand
Oil & Gas | Travel & Transportation
November 23, 2020 – COVID-19 and geopolitics have sharply affected demand for transport of crude oil and many bulk products. After a short-term rebound, demand likely will remain lower for longer. Meantime, outstanding orders will continue to increase tanker supply.
To read the article, see “Data will decide success in the next normal of bulk and tanker shipping,” November 16, 2020.
customizer here
Visual form
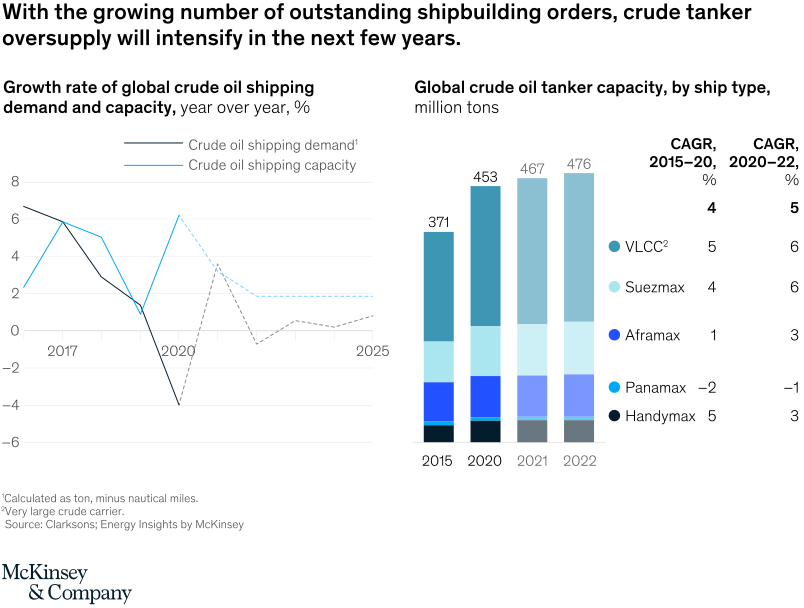
Multi-panel shipping-capacity comparison chart.
Layout / body structure
The chart is arranged as three related panels: a year-by-year demand-versus-capacity comparison at the top, a ship-type capacity table in the middle, and CAGR rows at the bottom. Read top to bottom, using the first panel to see the mismatch over time and the lower panels to see which ship types drive the capacity build-out.
What is being compared
It compares global crude-oil shipping demand growth with crude-oil shipping capacity growth from 2016 to 2025, and then compares tanker capacity across VLCC, Suezmax, Aframax, Panamax, and Handymax ship types. The bottom section compares historical and forward growth rates by ship type.
Measurement system
The top panel uses year-over-year percentage growth, the middle panel uses million tons of capacity, and the bottom panel uses CAGR percentages. The chart therefore asks the reader to track both relative growth rates and absolute fleet capacity across the same story.
Visible structure inside the graphic
The first panel lines up annual demand and capacity growth side by side by year, making the post-2020 oversupply gap easy to spot. The middle section totals fleet capacity by ship type across selected years, and the bottom section condenses those ship-type changes into CAGR rows for 2015 to 2020 and 2020 to 2022.
Main takeaway from the visual
Capacity keeps expanding even as demand weakens, so the supply imbalance is built into the fleet pipeline rather than being a one-year anomaly. The visual makes oversupply look structural because the capacity side stays positive and growing while demand turns sharply negative in 2020 and remains modest afterward.
Key standout values or extremes
The sharpest contrast is in 2020, when demand falls 4.0 percent while capacity still rises 6.2 percent. In the fleet breakdown, total tanker capacity rises from 371 million tons in 2015 to 453 in 2020 and 476 by 2022, with VLCCs growing from 193 to 263 million tons and remaining the largest ship-type block throughout.
Controls / sequence, when applicable
This is a static chart image with no in-chart controls to operate.
Companion media, when applicable
There is no separate companion audio or video; the chart image is the full visual on this page.