Source page: McKinsey & Company
Commentary
Total stimulus for the COVID-19 crisis already triple that for the entire 2008–09 recession
COVID-19 | Economics
June 11, 2020 – Governments allocated $10 trillion for economic stimulus in just two months—and for some countries, their response as a percentage of GDP was nearly ten times what it was in the financial crisis of 2008–09.
To read the article, see “The $10 trillion rescue: How governments can deliver impact,” June 5, 2020.
customizer here
Visual form
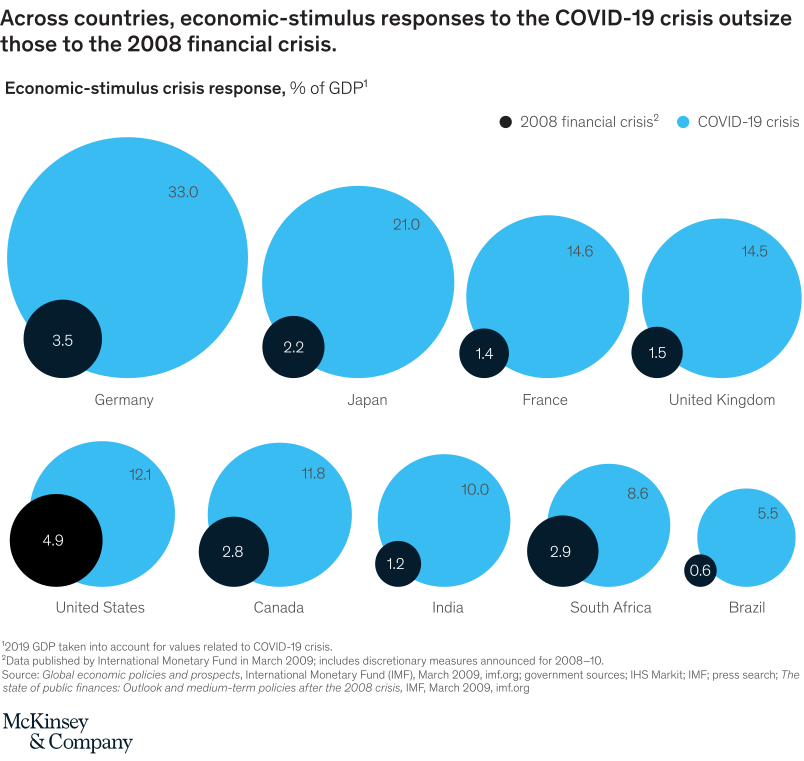
Table (with Visual Encoding): country grid of paired proportional bubbles for COVID-19 and 2008 stimulus.
Layout / body structure
Each country occupies its own small panel in a grid. Inside each panel, a blue bubble represents COVID-19 crisis stimulus and a dark bubble represents 2008 financial-crisis stimulus, with labels giving the values as shares of GDP.
What is being compared
It compares economic-stimulus responses to the COVID-19 crisis with responses during the 2008 financial crisis across several countries. The country grid lets the reader compare both within each country and across countries.
Measurement system
Stimulus is measured as percent of GDP. Bubble size provides the visual encoding for the magnitude, and the printed labels give the exact COVID-19 and 2008 values.
Visible structure inside the graphic
The blue COVID-19 bubbles are much larger than the dark 2008 bubbles in every country shown. Germany, Japan, France, and the United Kingdom have especially large COVID-19 bubbles relative to their 2008 markers.
Main takeaway from the visual
The visual shows that the COVID-19 fiscal response quickly exceeded the 2008-09 response by a wide margin. The paired bubbles make the scale difference visible country by country.
Key standout values or extremes
Germany shows 33.0 percent of GDP for COVID-19 versus 3.5 percent for 2008. Japan shows 21.0 versus 2.2, France 14.6 versus 1.4, and the United States 12.1 versus 4.9.
Controls / sequence, when applicable
This is a static table with proportional-bubble encoding; there are no in-chart controls to operate.
Companion media, when applicable
There is no separate companion audio or video; the proportional-bubble country grid is the full visual on this page.