Source page: McKinsey & Company
Commentary
Toxic exodus
Mental health | Jobs
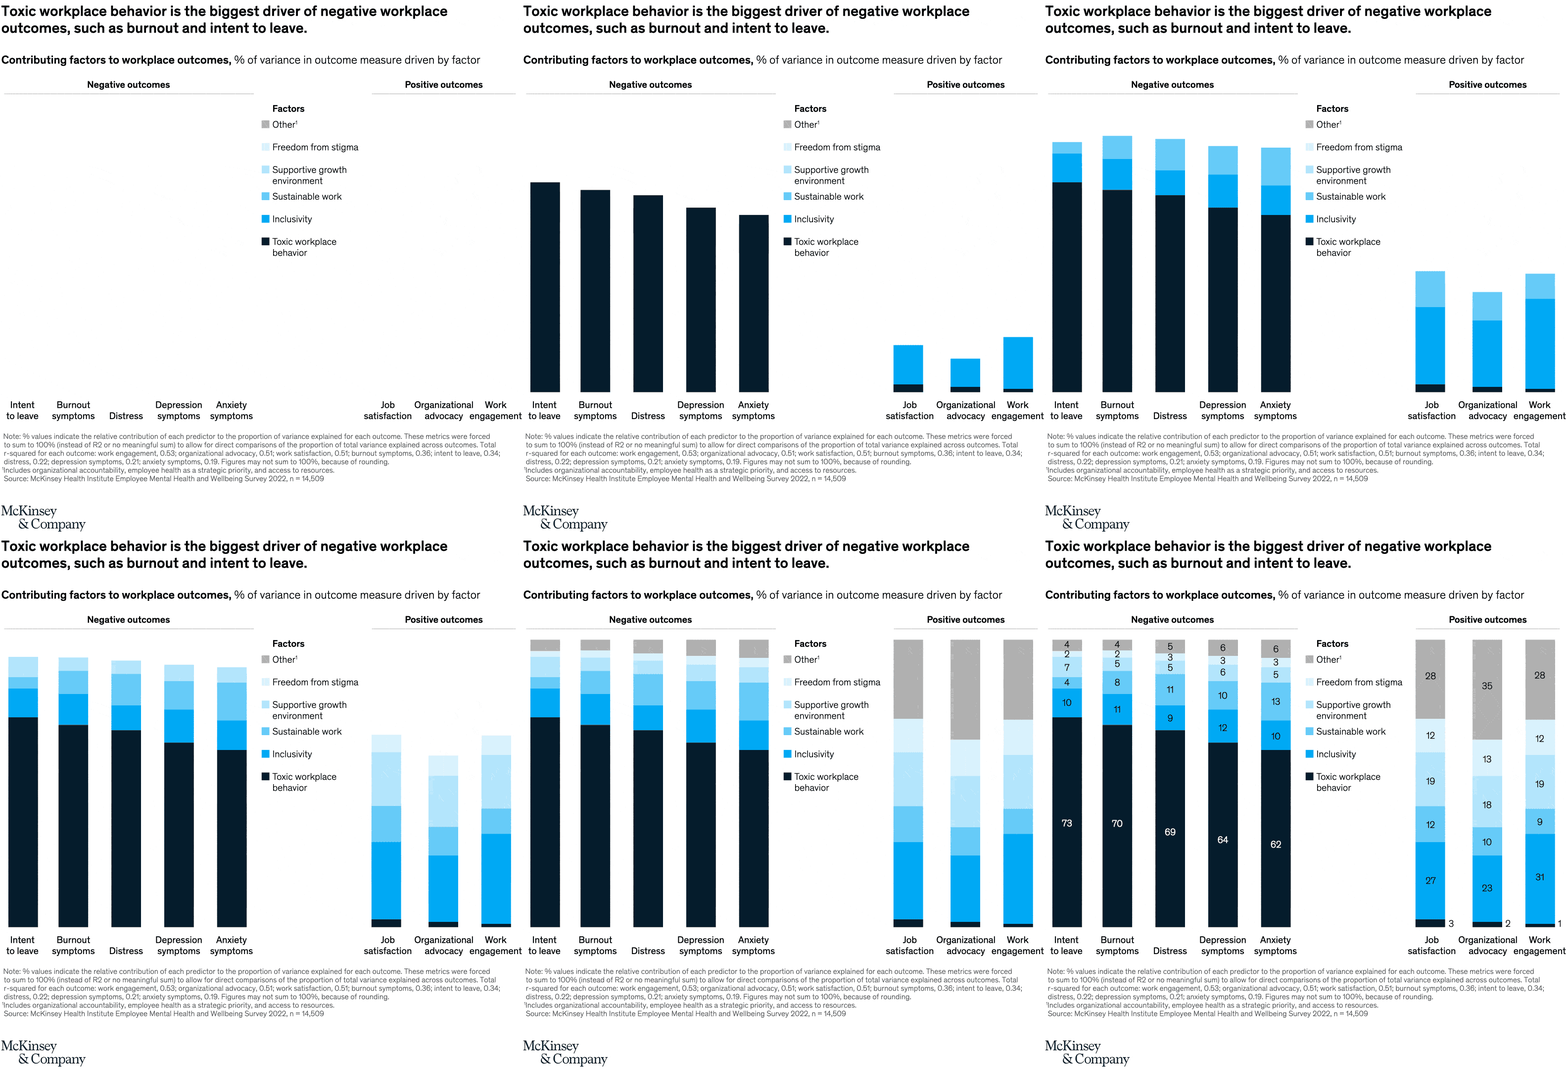
July 26, 2022 – Toxic workplace behavior is the biggest predictor of employee burnout symptoms and intent to leave, according to our research. More than 60 percent of negative workplace outcomes are due to toxic workplace behavior. When it comes to positive outcomes, contributing factors—including inclusivity, supportive growth environment, and sustainable work—are much more varied.
To read the article, see “Addressing employee burnout: Are you solving the right problem?,” May 27, 2022.
customizer here
Visual form
Contribution chart built from stacked horizontal bars.
Layout / body structure
The chart splits outcomes into two blocks read from left to right across the page: negative outcomes on the left and positive outcomes on the right. Each row is a horizontal stacked bar, and the legend in the middle identifies how much of each row comes from toxic workplace behavior, inclusivity, sustainable work, supportive growth environment, freedom from stigma, and other factors.
What is being compared
The chart compares the drivers of several workplace outcomes, including intent to leave, burnout symptoms, distress, depression symptoms, anxiety symptoms, job satisfaction, organizational advocacy, and work engagement. It shows how much of the variance in each outcome is associated with different workplace factors.
Measurement system
Each stacked bar shows the percentage of variance in an outcome measure explained by the listed factors, and the note below provides an r-squared value for each outcome. Color is doing most of the measurement work here, because the segment widths show the relative contribution of each factor category inside each row.
Visible structure inside the graphic
The left-side negative rows are dominated by a large toxic-workplace-behavior segment, while the right-side positive rows are more evenly divided among supportive growth environment, inclusivity, sustainable work, and freedom from stigma. The center legend ties the same six colors across both sides so the viewer can see how the composition shifts between harmful and constructive outcomes.
Main takeaway from the visual
The chart makes one point immediately visible: toxic workplace behavior is the single biggest driver of negative workplace outcomes. Positive outcomes are not concentrated in one overpowering factor in the same way; they are built from a broader mix of supportive conditions.
Key standout values or extremes
The note reports r-squared values of 0.34 for intent to leave, 0.51 for burnout symptoms, 0.36 for distress, 0.22 for depression symptoms, 0.21 for anxiety symptoms, 0.51 for job satisfaction, 0.34 for organizational advocacy, and 0.53 for work engagement. Visually, the toxic-workplace-behavior segment is widest on the negative side, while work engagement shows the strongest modeled fit on the positive side.
Controls / sequence, when applicable
This is a static chart image with no in-chart controls to operate.
Companion media, when applicable
There is no separate companion audio or video; the chart image is the full visual on this page.