Source page: McKinsey & Company
Commentary
Trade tectonics
Geopolitics | Global Trade
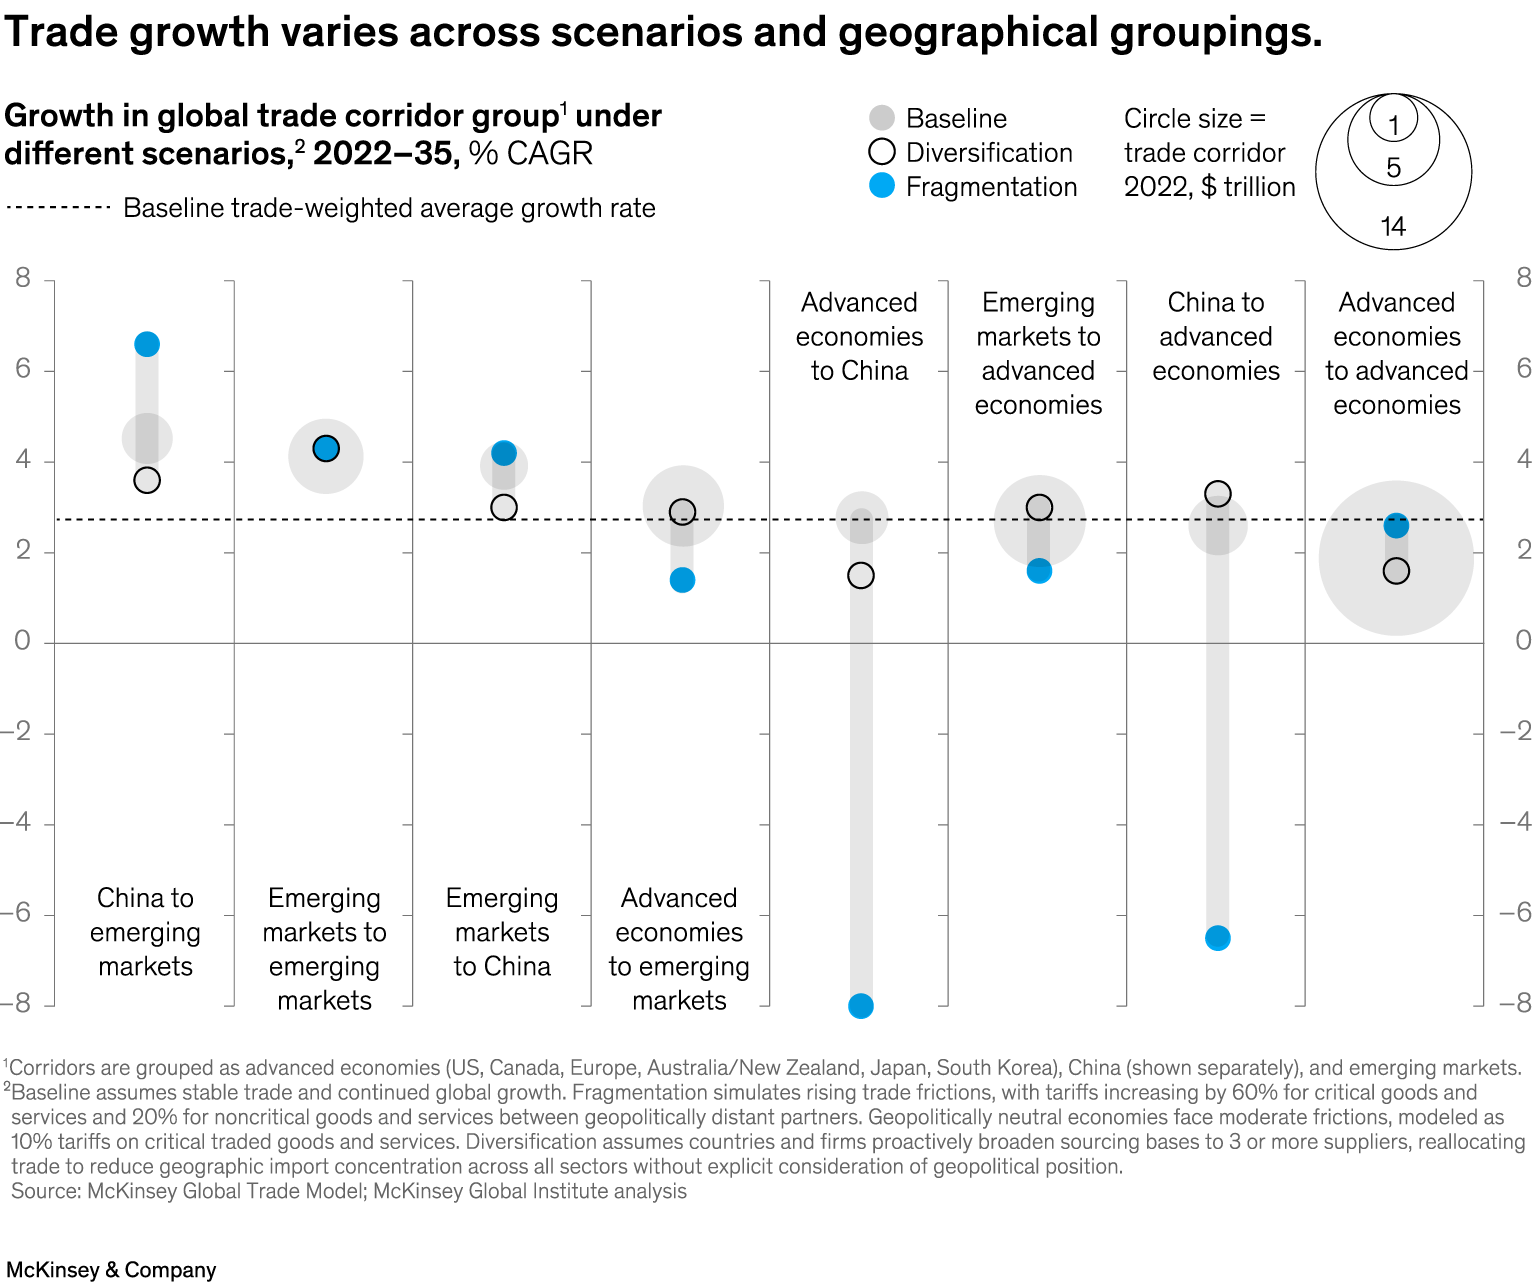
July 31, 2025 – The global trade system is on the brink of major change, but patterns differ significantly across scenarios. In the baseline scenario, by 2035, trade corridors between emerging markets and China could grow 4–5 percent annually, while those involving advanced economies could grow at 2 percent. In a fragmentation scenario, trade between China and advanced economies could drop significantly, but trade among advanced economies would accelerate, according to Senior Partner Olivia White and coauthors. And while trade between China and emerging markets would grow faster under fragmentation, it would slow under diversification compared with baseline.
To read the article, see “A new trade paradigm: How shifts in trade corridors could affect business,” June 18, 2025.
customizer here
Visual form
Scatter Plot: bubble small-multiple chart of trade-corridor CAGR scenarios from 2022 to 2035.
Layout / body structure
Trade corridors are arranged as vertical small-multiple columns across the page. Within each corridor, scenario bubbles are positioned on the same vertical growth-rate scale, and a dashed reference line spans the full chart.
What is being compared
It compares projected trade growth for corridor groups under baseline, diversification, and fragmentation scenarios.
Measurement system
The vertical axis is CAGR in percent, running from negative to positive growth. Bubble size represents 2022 corridor value in dollars, and bubble color or fill distinguishes the scenario.
Visible structure inside the graphic
Each corridor column contains stacked scenario bubbles at different growth rates. The size legend shows example corridor values of 1, 5, and 14 trillion dollars, while the dashed line gives a common baseline reference across all corridor groups.
Main takeaway from the visual
The chart shows that trade growth changes direction depending on both geography and scenario. Fragmentation produces strong positive growth in some China-emerging-market flows while sharply reducing several advanced-economy corridors.
Key standout values or extremes
China-to-emerging-market trade reaches one of the highest fragmentation cases at about 6.6 percent CAGR. Advanced economies to China falls to about negative 8 under fragmentation, China to advanced economies falls to roughly negative 6.5, and advanced-economy-to-advanced-economy trade is the largest corridor at about 14 trillion dollars.
Controls / sequence, when applicable
This is a fixed bubble scatter plot; there are no in-chart controls to operate.
Companion media, when applicable
There is no separate companion audio or video; the trade-corridor bubble chart is the visual on this page.