Source page: McKinsey & Company
Commentary
Trade turmoil takes hold
Economy | Geopolitics | Global Trade
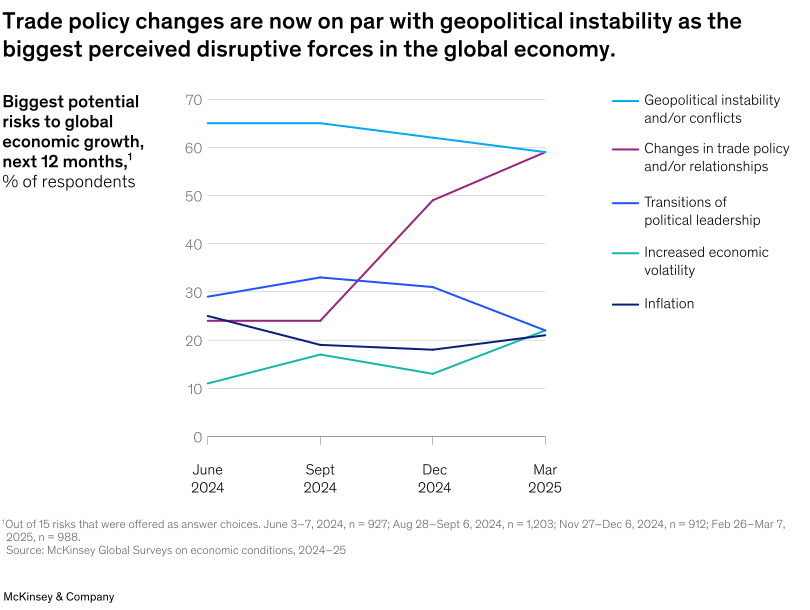
April 23, 2025 – Uncertainty looms in the latest McKinsey Global Survey on economic conditions, say Senior Partner Sven Smit and coauthors. Trade policy changes and geopolitical instability are now seen as the primary disruptors. Geopolitical risks have dominated survey respondents’ focus for the past three years, but concerns related to trade issues have surged and are now on par with geopolitics. In fact, over the past six months, the share of respondents citing trade-related changes as a major disruption to the global economy has more than doubled.
To read the survey, see “Economic conditions outlook, March 2025,” March 28, 2025.
customizer here
Visual form
Line Chart: five-series survey time series of perceived risks to global economic growth.
Layout / body structure
Survey dates run from June 2024 to March 2025 along the horizontal axis. Five colored lines track risk categories across the same four survey points, with the legend placed to the right.
What is being compared
It compares the share of respondents naming geopolitical instability, trade-policy changes, political-leadership transitions, economic volatility, and inflation as disruptive forces for global economic growth.
Measurement system
The vertical scale is percent of respondents. Each line color corresponds to one risk category, and each point marks a survey wave.
Visible structure inside the graphic
The geopolitical-instability line starts highest and eases downward, while the trade-policy line rises sharply from the mid-20s to the top of the chart. The other risk lines remain grouped well below the top two by March 2025.
Main takeaway from the visual
The chart shows trade policy moving from a secondary concern to a top perceived risk, ending the period level with geopolitical instability.
Key standout values or extremes
Geopolitical instability falls from about 65 percent in June 2024 to about 59 percent in March 2025. Trade-policy concerns rise from about 24 percent to about 59 percent, while the remaining risks finish near the low-20-percent range.
Controls / sequence, when applicable
This is a fixed multi-line time series; there are no in-chart controls to operate.
Companion media, when applicable
There is no separate companion audio or video; the global-risk line chart is the visual on this page.