Source page: McKinsey & Company
Commentary
Trading down
Consumer | Latin America
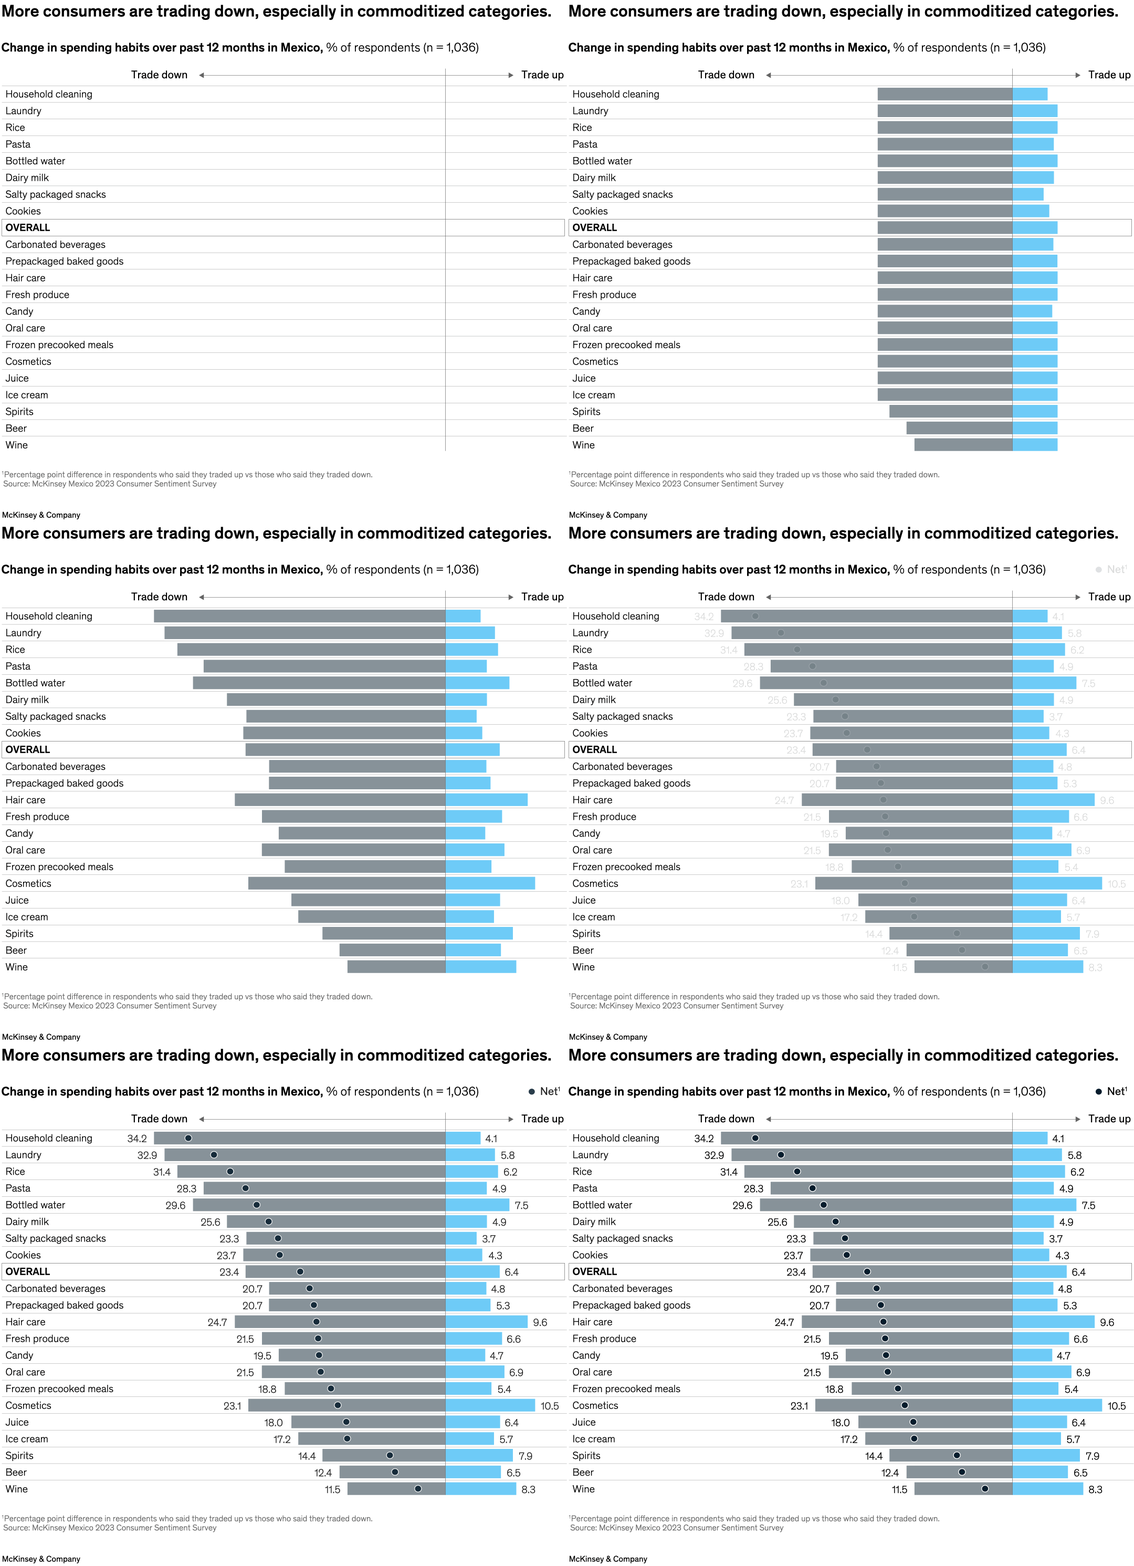
July 24, 2023 – Even though Mexican consumers are feeling somewhat more optimistic about both the economy and their finances, the positive sentiment isn’t apparent in their shopping habits. In a survey, 67 percent of respondents reported cutting spending in the past 12 months, an increase of 20 percentage points from prepandemic levels. Partner Fernando Hiraoka and colleague find that 23 percent of respondents—up from 20 percent in 2021—say that they’re trading down across their entire shopping basket, with household cleaning products, laundry supplies, rice, pasta, and bottled water seeing the most change.
To read the article, see “Mexican consumers seek value and convenience—and find it online,” June 28, 2023.
customizer here
Visual form
Diverging category-comparison chart.
Layout / body structure
A single category list runs top to bottom, with a center line and directional cue showing trade down to the left and trade up to the right.
What is being compared
It compares how spending habits changed across consumer categories in Mexico over the past twelve months, including staples, beverages, personal care items, and an overall row.
Measurement system
The measure is percentage-point net difference between respondents who say they traded down and those who say they traded up.
Visible structure inside the graphic
Category labels anchor the left side, the center rule provides the neutral reference, and each row is designed to show whether the category leans toward trading down or trading up.
Main takeaway from the visual
The chart is built to show that consumers are trading down most clearly in commoditized everyday categories, while few categories push meaningfully in the opposite direction.
Key standout values or extremes
The strongest visible contrast is the concentration of staples and household categories on the trade-down side, with the overall row also positioned in that direction.
Controls / sequence, when applicable
This is a static chart image with no in-chart controls to operate.
Companion media, when applicable
There is no separate companion audio or video; the chart image is the full visual on this page.