Source page: McKinsey & Company
Commentary
Two scoops of ethical ice cream, please
Consumer | Retail | Food
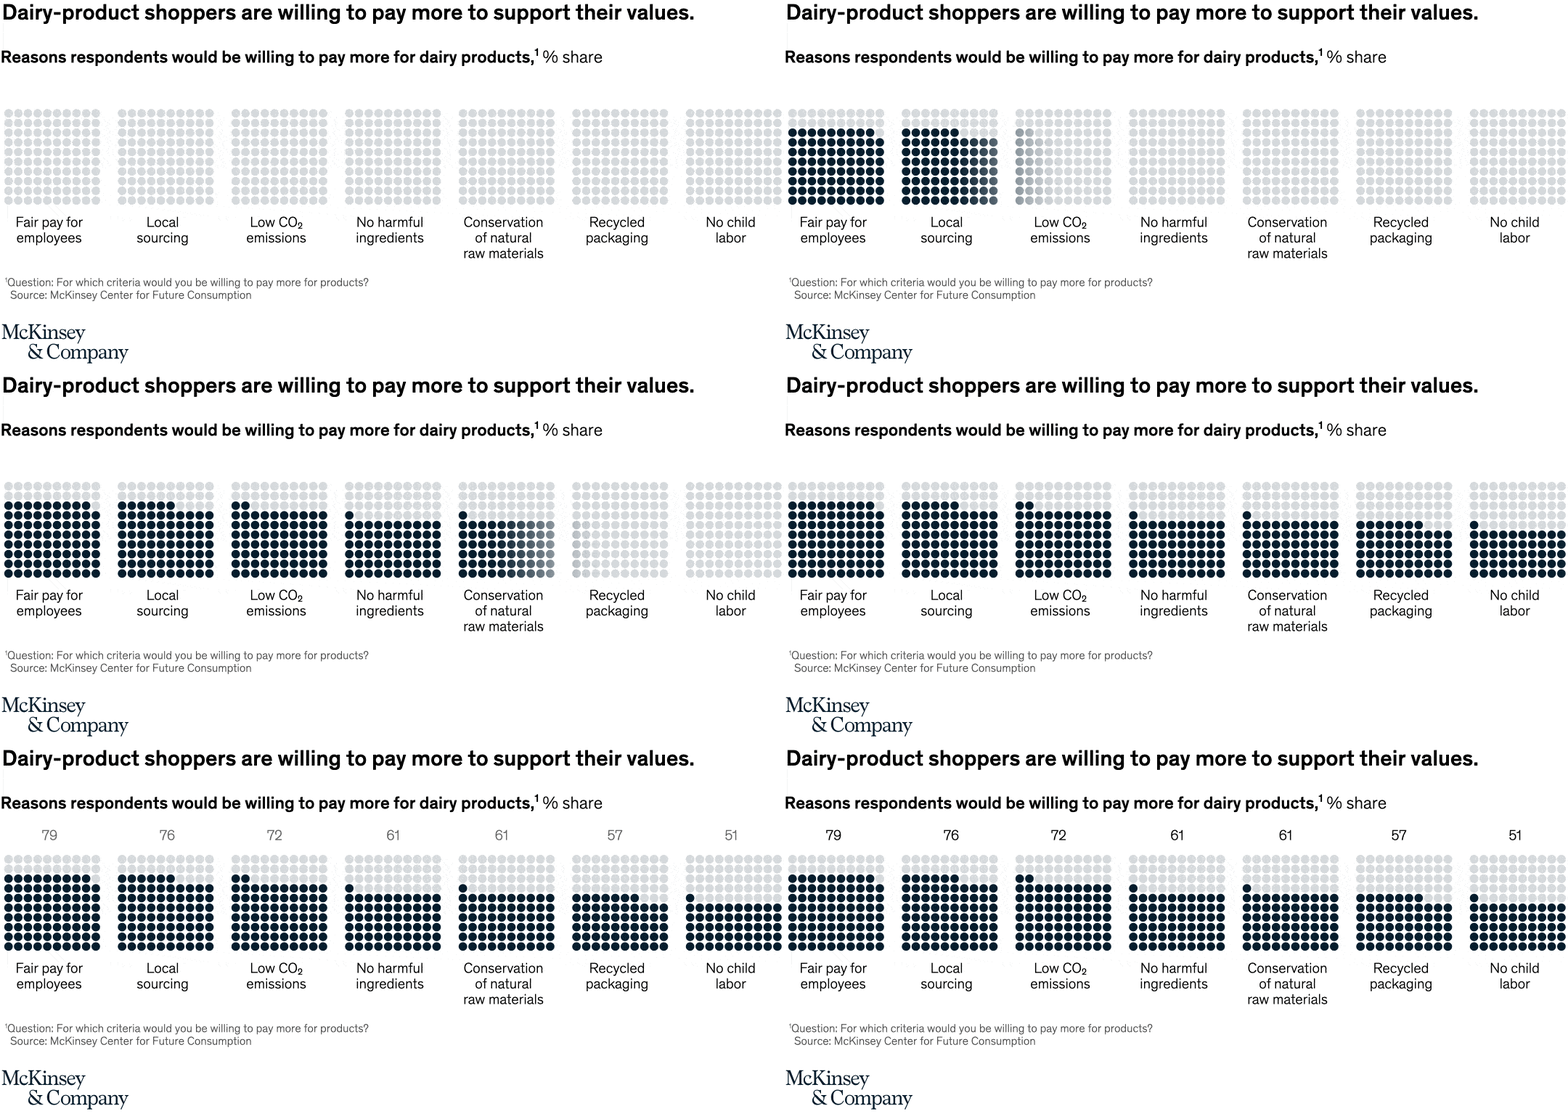
June 14, 2022 – When it comes to dairy products, consumers put a premium on ethical claims. According to our research, more than seven in ten shoppers are willing to pay more for products from producers who pay workers fairly, operate locally, and emit less carbon, for example.
To read the article, see “How to stay cool as competition heats up in ice cream and yogurt,” May 13, 2022.
customizer here
Visual form
Dot-matrix comparison chart.
Layout / body structure
The chart is a single horizontal row of seven 10 by 10 dot grids. Read it left to right across the claim categories, using the number above each grid and the label below it together.
What is being compared
Each grid compares a different ethical claim that could make dairy-product shoppers willing to pay more, including fair pay, local sourcing, lower CO2 emissions, ingredient safety, conservation, recycled packaging, and child labor.
Measurement system
The measure is percent share. Each grid works like a 100-dot icon array, with the dark filled dots showing the willing-to-pay share and the light dots showing the remainder.
Visible structure inside the graphic
Seven separate dot matrices are lined up in one row, each topped with a percentage and captioned underneath. The dark dots fill most of the grid on the left-hand categories and gradually thin out toward the rightmost category.
Main takeaway from the visual
The visual shows that ethical claims command a premium across the board, but labor and local-production claims are the strongest. Even the weakest claim on the page still keeps a majority of shoppers in the willing-to-pay-more camp.
Key standout values or extremes
The highest shares are fair pay for employees at 79 percent, local sourcing at 76 percent, and low CO2 emissions at 72 percent. The middle tier is no harmful ingredients and conservation of natural raw materials at 61 percent each, followed by recycled packaging at 57 percent, while no child labor is the lowest of the set at 51 percent.
Controls / sequence, when applicable
This is a static chart image with no in-chart controls to operate.
Companion media, when applicable
There is no separate companion audio or video; the chart image is the full visual on this page.