Source page: McKinsey & Company
Commentary
Uneven emissions trends
Decarbonization | Sustainability
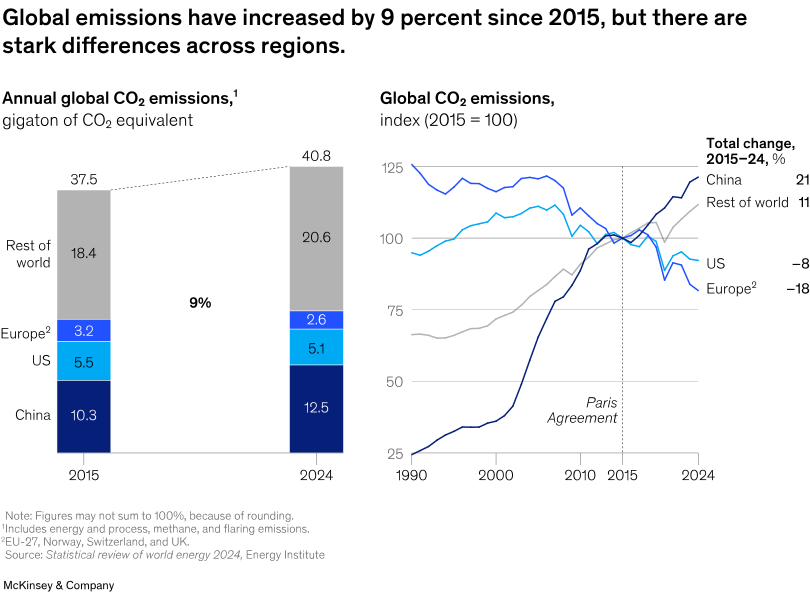
March 19, 2026 – The world is not yet on track to meet 2030 or 2050 decarbonization goals, as global CO2 emissions have increased by 9 percent since the 2015 Paris Agreement. This overall figure masks different trajectories across regions, however. McKinsey’s Adam Barth, Diego Hernandez Diaz, Humayun Tai, Thomas Hundertmark, and Michiel Nivard note that although Europe and the United States have reduced their emissions by 18 percent and 8 percent, respectively, these cuts have been more than offset by increases elsewhere. Emissions from China rose by 21 percent, and emissions from the rest of the world grew by 11 percent during the same period.
To read the article, see “Tracking the energy transition: Where are we now?,” January 14, 2026.
customizer here
Visual form
Stacked Bar / Stacked Column and Line Chart: dual-panel regional CO2-emissions comparison since the Paris Agreement.
Layout / body structure
The left panel stacks annual global emissions by region, showing how China, the United States, Europe, and the rest of the world add up to the global total. The right panel uses indexed lines to compare each region’s emissions path over time, with 2015 marked as the Paris Agreement reference point.
What is being compared
It compares regional contributions to global CO2 emissions and the indexed change in emissions for China, the United States, Europe, and the rest of the world.
Measurement system
The stacked-bar panel uses gigatons of CO2 equivalent per year. The line-chart panel indexes emissions to 2015 = 100 so regional changes can be compared on a common scale.
Visible structure inside the graphic
The stacked bars show the global total rising from 37.5 gigatons in 2015 to 40.8 gigatons in 2024. The indexed lines split after 2015, with China and the rest of the world rising while the United States and Europe decline.
Main takeaway from the visual
The visual shows that global emissions have increased even though the United States and Europe have reduced theirs. Growth in China and the rest of the world has more than offset those reductions.
Key standout values or extremes
Global emissions are up 9 percent since 2015. China rises 21 percent, the rest of the world rises 11 percent, the United States falls 8 percent, and Europe falls 18 percent.
Controls / sequence, when applicable
This is a static dual-panel emissions chart; there are no in-chart controls to operate.
Companion media, when applicable
There is no separate companion audio or video; the emissions stacked-bar and line-chart chart is the full visual on this page.