Source page: McKinsey & Company
Commentary
Up, up, and away
Cloud | Technology
November 23, 2021 – Fifteen percent of the companies we surveyed successfully migrated most of their applications to the cloud on time and on budget. How did they do it? Pro tip: be prepared to pull the plug on data-center funding, even if it means paying early termination fees.
To read article, see “Cloud-migration opportunity: Business value grows, but missteps abound,” October 12, 2021.
customizer here
Visual form
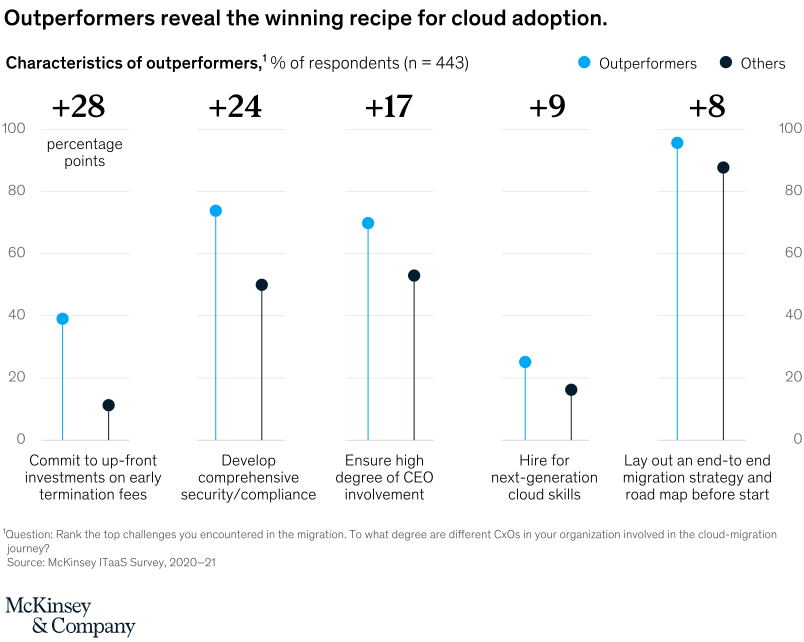
Five-category lollipop comparison chart.
Layout / body structure
The chart is a single row of five vertical comparisons, one for each cloud-adoption characteristic. Reader moves left to right across the categories, comparing the blue outperformer marker against the dark marker for others within each vertical scale.
What is being compared
The chart compares outperformers and others on five characteristics of cloud migration. The categories are committing to upfront investments on early termination fees, developing comprehensive security or compliance, ensuring a high degree of CEO involvement, hiring for next-generation cloud skills, and laying out an end-to-end migration strategy and road map before starting.
Measurement system
The chart is measured as percent of respondents on a 0 to 100 scale, with the gap between the two groups also called out above each category in percentage points. Each category shows a blue dot and line for outperformers and a dark dot and line for others.
Visible structure inside the graphic
Each category is drawn as a vertical pair of stems ending in circular markers. Above the five categories sit printed gaps of plus 28, plus 24, plus 17, plus 9, and plus 8 percentage points, and the marker positions show blue above dark in every category, with the highest pair appearing at the far right for strategy and road map before start.
Main takeaway from the visual
Outperformers lead others across every cloud-adoption characteristic on the page, with the biggest advantages appearing in willingness to make upfront investments and in comprehensive security or compliance. Because the blue markers sit above the dark markers in all five columns, the visual reads as a clean all-category advantage for outperformers rather than a mixed picture.
Key standout values or extremes
The largest gap is plus 28 percentage points for committing to upfront investments on early termination fees, followed by plus 24 for comprehensive security or compliance and plus 17 for CEO involvement. The highest absolute marker levels appear in the final category, where outperformers sit in the mid-90s and others in the high-80s for laying out an end-to-end migration strategy and road map before start.
Controls / sequence, when applicable
This is a static chart image with no in-chart controls to operate.
Companion media, when applicable
There is no separate companion audio or video; the chart image is the full visual on this page.