Source page: McKinsey & Company
Commentary
US companies out-invest Europe
Investing | Europe | Technology
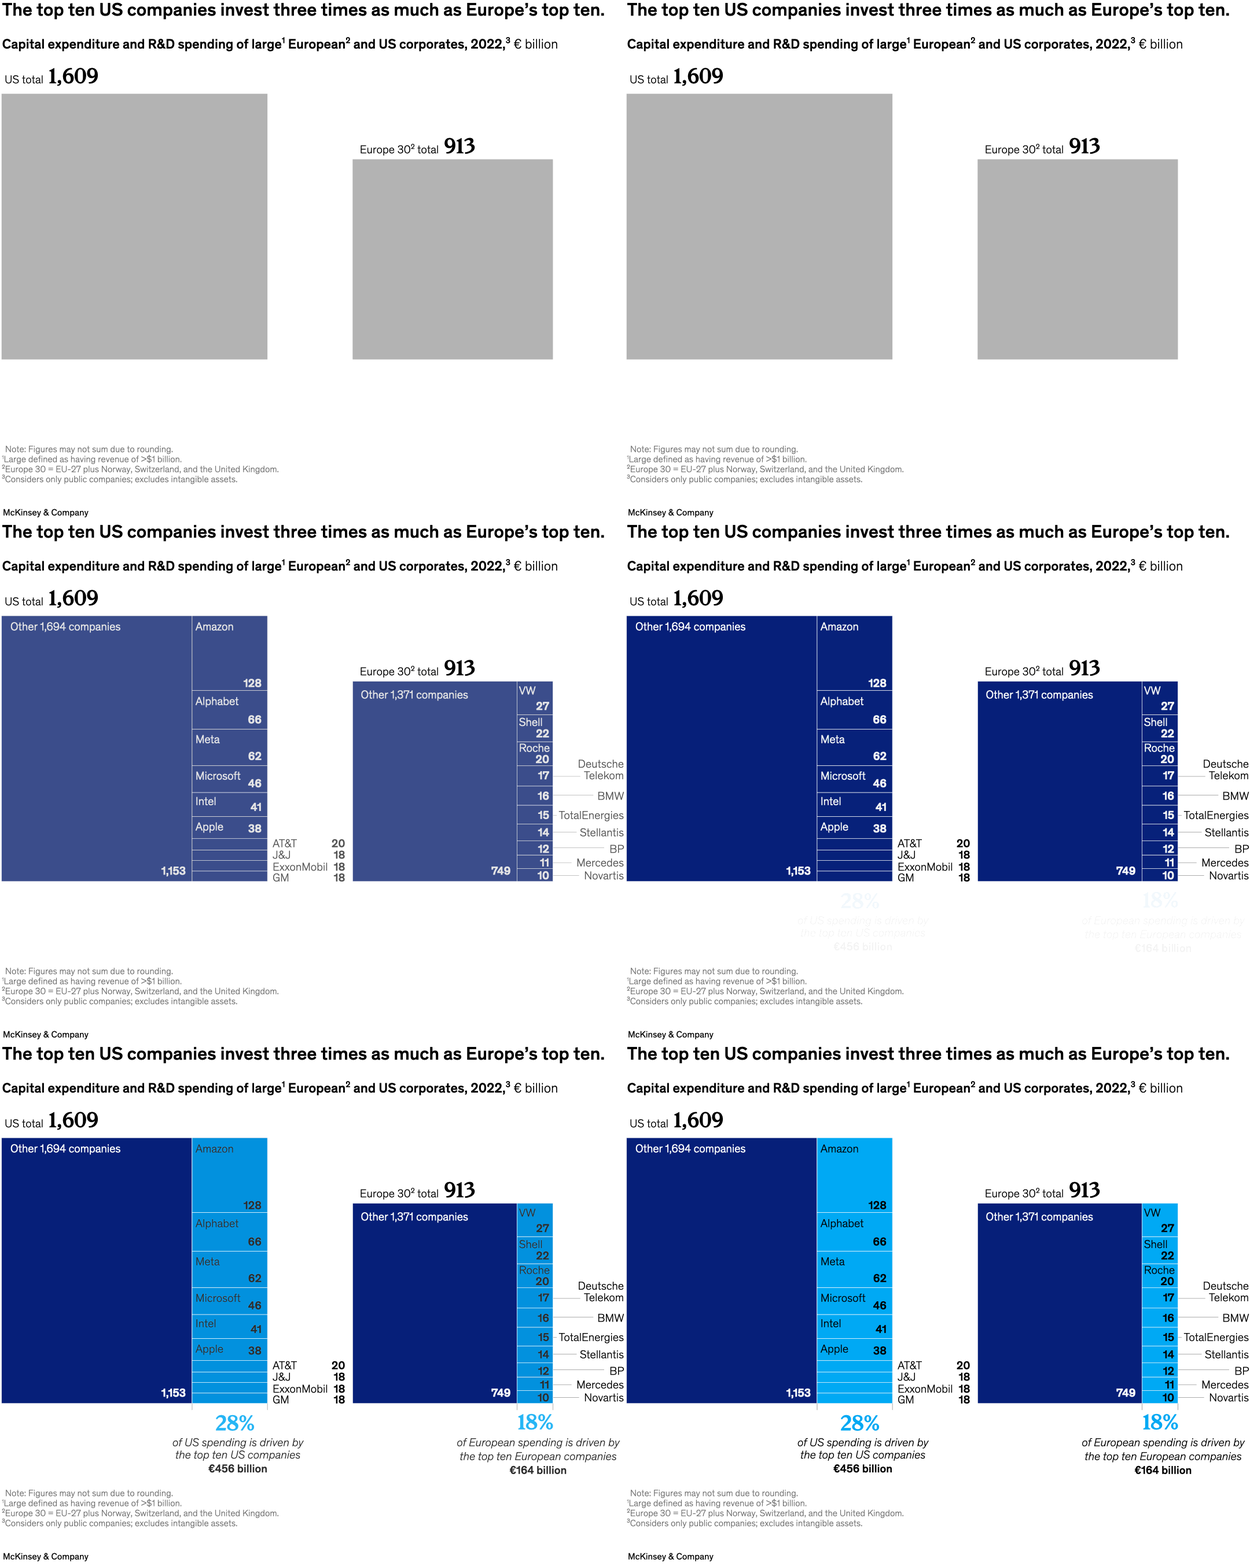
July 19, 2024 – US companies are investing significantly more than their European counterparts in capital expenditure and R&D, according to senior partner and McKinsey Global Institute chair Sven Smit and coauthors. The top ten US companies—the top six of which are tech companies—fueled 28 percent of overall US spending in 2022, while the top ten European companies propelled 18 percent of European spending. The top ten US companies invest three times as much as their European counterparts.
To read the article, see “Investment: Taking the pulse of European competitiveness,” June 20, 2024.
customizer here
Visual form
Side-by-side treemap comparison.
Layout / body structure
The page places a US treemap on the left and a Europe treemap on the right, each split into a large ‘other companies’ block and a narrow top-ten strip listing the biggest named spenders, with summary percentages called out below each side.
What is being compared
It compares capital expenditure and R&D spending by large US corporations versus large European corporations in 2022, including how much of each region’s total is driven by its top ten companies.
Measurement system
The values are in euro billions, with total regional spending labeled at the top of each treemap and individual company or group blocks labeled with their contribution amounts.
Visible structure inside the graphic
Each treemap uses one dominant dark block for the mass of other companies and a stack of bright blue rectangles for the top ten named firms, making the relative concentration and the overall difference in market size visible at the same time.
Main takeaway from the visual
The US chart is both larger overall and more top-heavy in absolute terms, which makes the headline claim visible immediately: the top US companies drive far more capex and R&D spending than Europe’s top ten.
Key standout values or extremes
US total spending is shown at EUR 1,609 billion versus Europe’s EUR 913 billion; the top ten US companies account for EUR 456 billion, or 28 percent, while the top ten European companies account for EUR 164 billion, or 18 percent; Amazon alone is labeled at 128, and Europe’s top named company, VW, is labeled at 27.
Controls / sequence, when applicable
This is a static chart image with no in-chart controls to operate.
Companion media, when applicable
There is no separate companion audio or video; the chart image is the full visual on this page.