Source page: McKinsey & Company
Commentary
US disease burden expected to get heavier over the next 20 years
Public Health | North America
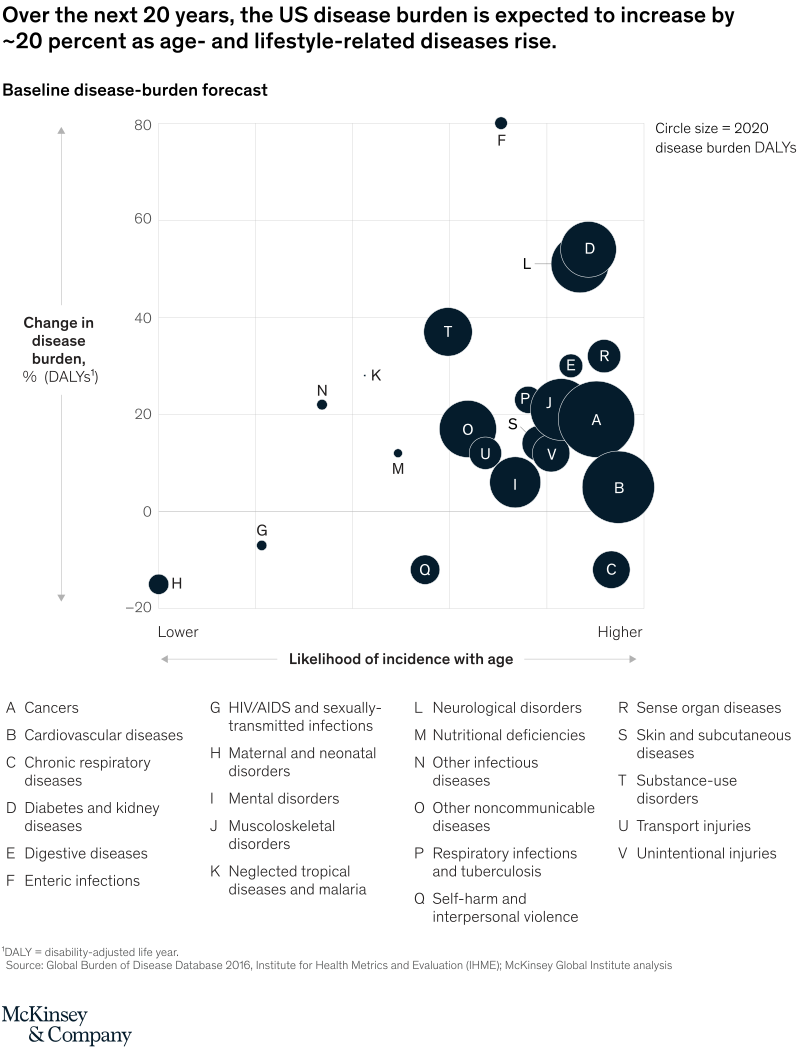
October 21, 2020 – The likelihood of age- and lifestyle-related diseases—including cardiovascular diseases, cancers, and neurological disorders—is expected to increase by about 20 percent through 2040. However, the incidence of chronic respiratory diseases is likely to drop.
To read the article, see “How prioritizing health is a prescription for US prosperity,” October 5, 2020.
customizer here
Visual form
Scatter Plot: bubble scatter chart of US disease-burden size and projected change through 2040.
Layout / body structure
The chart uses one scatter field with lettered bubbles. Horizontal position shows projected burden change, and bubble size shows the relative 2020 burden for each disease group.
What is being compared
It compares major US disease categories by projected change in burden through 2040 and by the approximate scale of their current burden.
Measurement system
The horizontal axis measures percent change in disease burden using DALYs. Bubble area represents approximate 2020 burden level, and letter labels connect bubbles to disease names.
Visible structure inside the graphic
Large bubbles on the growth side show that several already-heavy disease categories are expected to increase. Smaller or left-side bubbles identify categories with less current burden or projected decline.
Main takeaway from the visual
The chart shows disease burden getting heavier because large age- and lifestyle-related categories are expected to keep growing, not because every disease category moves in the same direction.
Key standout values or extremes
Diabetes and kidney diseases rise 54 percent, and neurological disorders rise 51 percent. Cancers rise 19 percent from a large base, cardiovascular diseases rise 7 percent from another large base, while chronic respiratory diseases and self-harm and interpersonal violence decline 12 percent.
Controls / sequence, when applicable
This is a static bubble scatter plot; there are no in-chart controls to operate.
Companion media, when applicable
There is no separate companion audio or video; the US disease-burden scatter plot is the full visual on this page.