Source page: McKinsey & Company
Commentary
Utilities' water worries
Energy | Climate change
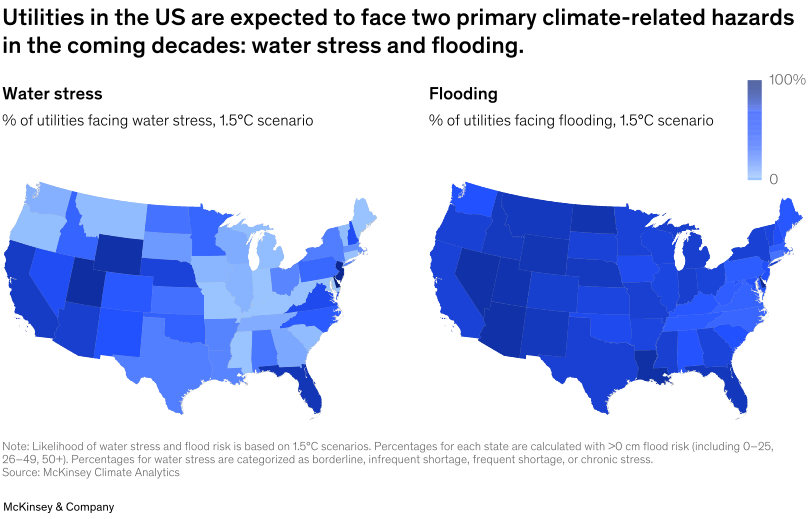
April 16, 2025 – Utilities across the United States are projected to encounter significant challenges from water stress and flooding in the coming decades in the current 1.5° climate scenario, in which global warming is held to 1.5°C above preindustrial levels. Senior Partner Humayun Tai and coauthors note that as many as 47 states contain a utility facing water stress, while all 50 states have utilities that are at risk of flooding in a 100-year flood. These climate-related threats pose major operational and financial risks to utility companies.
To read the report, see “Water resilience: Closing the funding gap for utilities,” March 11, 2025.
customizer here
Visual form
Dual choropleth map. The chart places two US maps side by side to compare water stress and flooding risk for utilities under the same climate scenario.
Layout / body structure
The page is split into two map panels: water stress on the left and flooding on the right. Reader compares the same national geography twice, using the shared blue color scale at the top right to judge relative intensity across states.
What is being compared
The visual compares the share of utilities facing water stress with the share facing flooding across US states. It is also comparing the two climate-related hazards against one another under a 1.5-degree scenario.
Measurement system
Both maps show percentages of utilities, scaled from 0 to 100 percent. Darker blue indicates a larger share of utilities exposed to the hazard, and the same color ramp is used for both panels so the two risks can be compared consistently.
Visible structure inside the graphic
Each panel is a state-level filled map of the United States, with no county-level detail and no internal bar or line elements. The left panel shades states according to water-stress exposure, the right panel does the same for flooding exposure, and the paired composition makes the second map read as a direct counterpart to the first.
Main takeaway from the visual
The visible takeaway is that flooding is widespread across almost the entire country, while water stress is also substantial but more geographically uneven. The flooding map is dark across most states, whereas the water-stress map shows a stronger west-and-south concentration with lighter pockets elsewhere.
Key standout values or extremes
The right-hand flooding map shows many states in dark blue, consistent with the accompanying note that all 50 states have utilities at flood risk. The left-hand water-stress map has fewer uniformly dark states, but the note says as many as 47 states contain a utility facing water stress, which shows how broad the exposure still is even outside the darkest clusters.
Controls / sequence, when applicable
This is a static chart image with no in-chart controls to operate.
Companion media, when applicable
There is no separate companion audio or video; the chart image is the full visual on this page.