Source page: McKinsey & Company
Commentary
Volatility is the new norm
Strategy | Risk
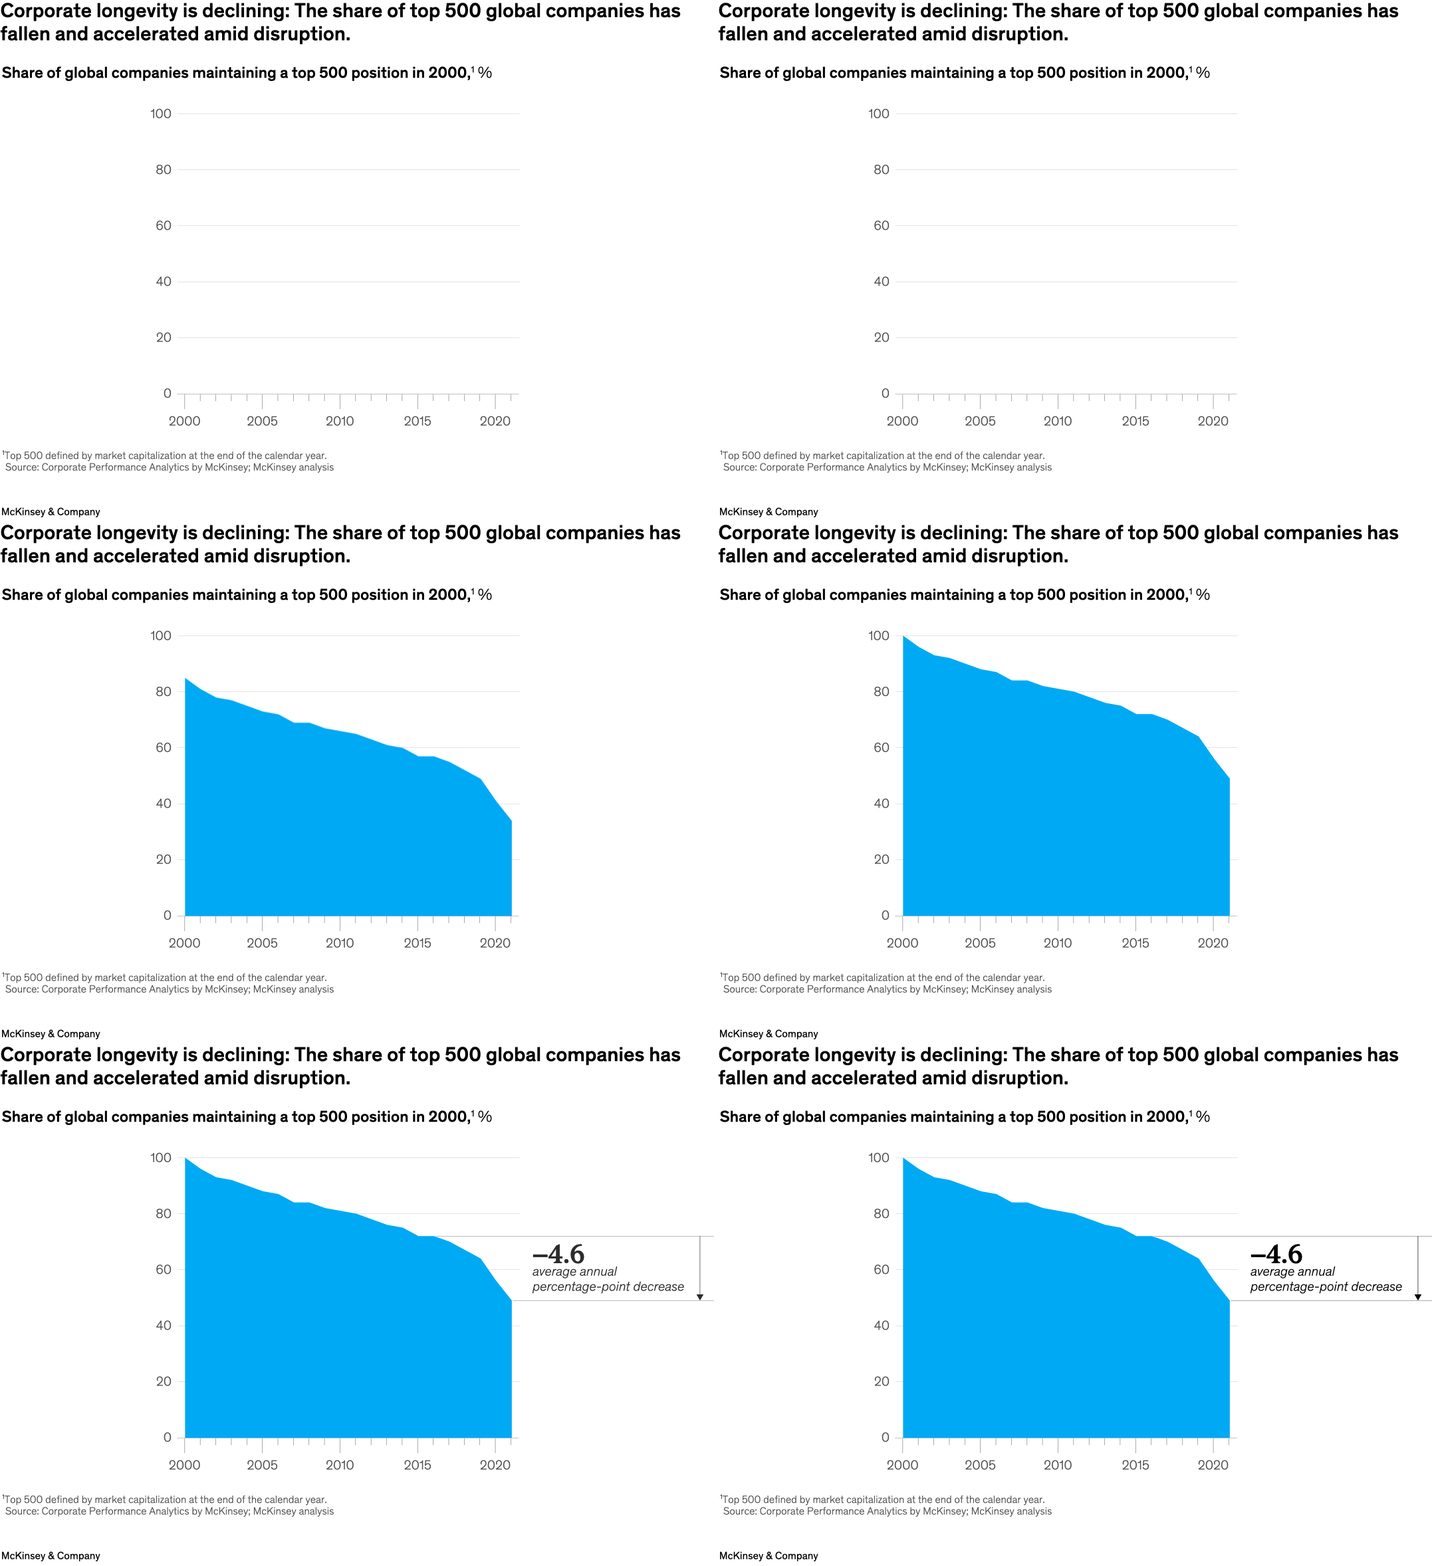
February 7, 2023 – The current economic uncertainty can be chalked up, in part, to recent events, including geopolitical instability, volatile commodity markets, and rising inflation. However, disruptions to global business have been years—even decades—in the making, find senior partners Ralf Dreischmeier and Ari Libarikian and coauthors. For example, the share of global companies maintaining a top 500 position has steadily fallen since 2000, with a 4.6 percent average annual slide in recent years.
To read the article, see “Business building: The path to resilience in uncertain times,” December 19, 2022.
customizer here
Visual form
Area chart.
Layout / body structure
The page uses a single time-series area chart read left to right from 2000 through the early 2020s, with one filled shape tracing the share of top 500 global companies that maintain their position over time.
What is being compared
It compares the share of global companies maintaining a top 500 position across years, showing how corporate longevity changes over time.
Measurement system
The vertical axis is percent share, and the x-axis is year, so the reader tracks the decline in the proportion of companies that stay in the top tier.
Visible structure inside the graphic
A solid blue filled area slopes steadily downward from near the top of the chart at the start of the series to around the midpoint by the end. A bracket annotation on the right marks the average annual percentage-point decrease.
Main takeaway from the visual
Corporate longevity is falling rather than stabilizing. The area’s continuous downward slope makes the decline feel structural, and the late-series drop appears steeper, reinforcing the idea that disruption has accelerated.
Key standout values or extremes
The chart begins near 100 percent in 2000 and falls to roughly 50 percent by the end of the period. The annotation marks an average annual percentage-point decrease of 4.6 in recent years.
Controls / sequence, when applicable
This is a static chart image with no in-chart controls to operate.
Companion media, when applicable
There is no separate companion audio or video; the chart image is the full visual on this page.