Source page: McKinsey & Company
Commentary
We put out an APB on APIs
Banking | Technology
November 22, 2021 – Application programming interfaces (APIs) rule the world of e-commerce. Every time you search for a flight, or buy pet food online, APIs connect the systems of the companies involved, to swap data quickly and efficiently. To find out where banks stand on the use of APIs, we surveyed 40 leading institutions. The top-line takeaway: banks believe they are about halfway to where they want to be.
To read the article, see “From tech tool to business asset: How banks are using B2B APIs to fuel growth,” October 5, 2021.
customizer here
Visual form
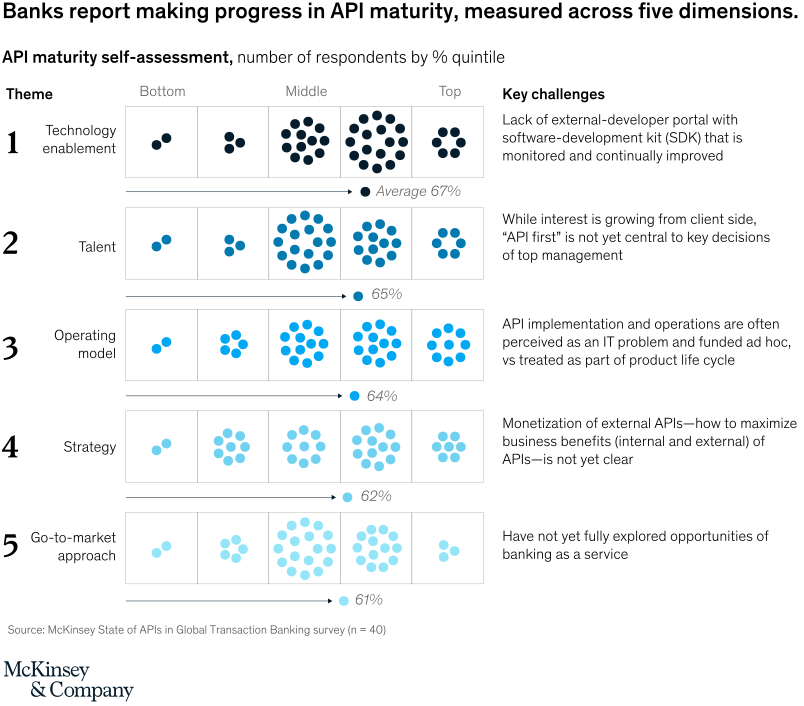
Five-row dot-matrix maturity chart.
Layout / body structure
The chart is arranged as five horizontal rows, one for each API-maturity theme, with a left-to-right quintile strip in the middle and a challenge statement on the right. Reader moves down the rows from technology enablement through go-to-market approach, reading each theme’s dot distribution first and then the accompanying challenge text.
What is being compared
The chart compares banks’ self-assessed API maturity across five dimensions: technology enablement, talent, operating model, strategy, and go-to-market approach. Within each row it also compares how respondent answers are distributed from the bottom quintile to the top quintile.
Measurement system
The visual uses the number of respondents by percentage quintile rather than a conventional x-y axis. Each dot stands in for respondents clustered into bottom, middle, and top quintiles, and each row is summarized by an average percentage printed at the end of an arrow.
Visible structure inside the graphic
Every row contains five boxed quintile positions filled with colored dots, plus an arrow ending in an average figure of 67, 65, 64, 62, or 61 percent. The densest dot clusters sit toward the middle and top quintiles, while the right-hand side of the page pairs each maturity row with a specific challenge statement such as SDK maintenance, API-first management attention, or monetization uncertainty.
Main takeaway from the visual
Banks report meaningful progress across API maturity, but they still see persistent gaps in execution and commercialization. The row averages sit in the low-to-mid 60s across all five dimensions, which makes the page read as solid but unfinished maturity rather than either clear immaturity or full optimization.
Key standout values or extremes
Technology enablement is highest at an average 67 percent, followed by talent at 65 and operating model at 64 percent. Strategy and go-to-market approach trail at 62 and 61 percent, making monetization and banking-as-a-service exploration the weakest visible rows in the set.
Controls / sequence, when applicable
This is a static chart image with no in-chart controls to operate.
Companion media, when applicable
There is no separate companion audio or video; the chart image is the full visual on this page.