Source page: McKinsey & Company
Commentary
We’ve only just begun
Women’s health | Innovation
May 16, 2022 – FemTech companies typically build largely tech-enabled, consumer-centric solutions addressing women’s health. While start-ups in this space are proliferating, there remains opportunities for innovation in services and support of menstrual health, menopause, and contraception as well as new products and devices.
To read the article, see “The dawn of the FemTech revolution,” February 14, 2022.
customizer here
Visual form
Heat-map matrix.
Layout / body structure
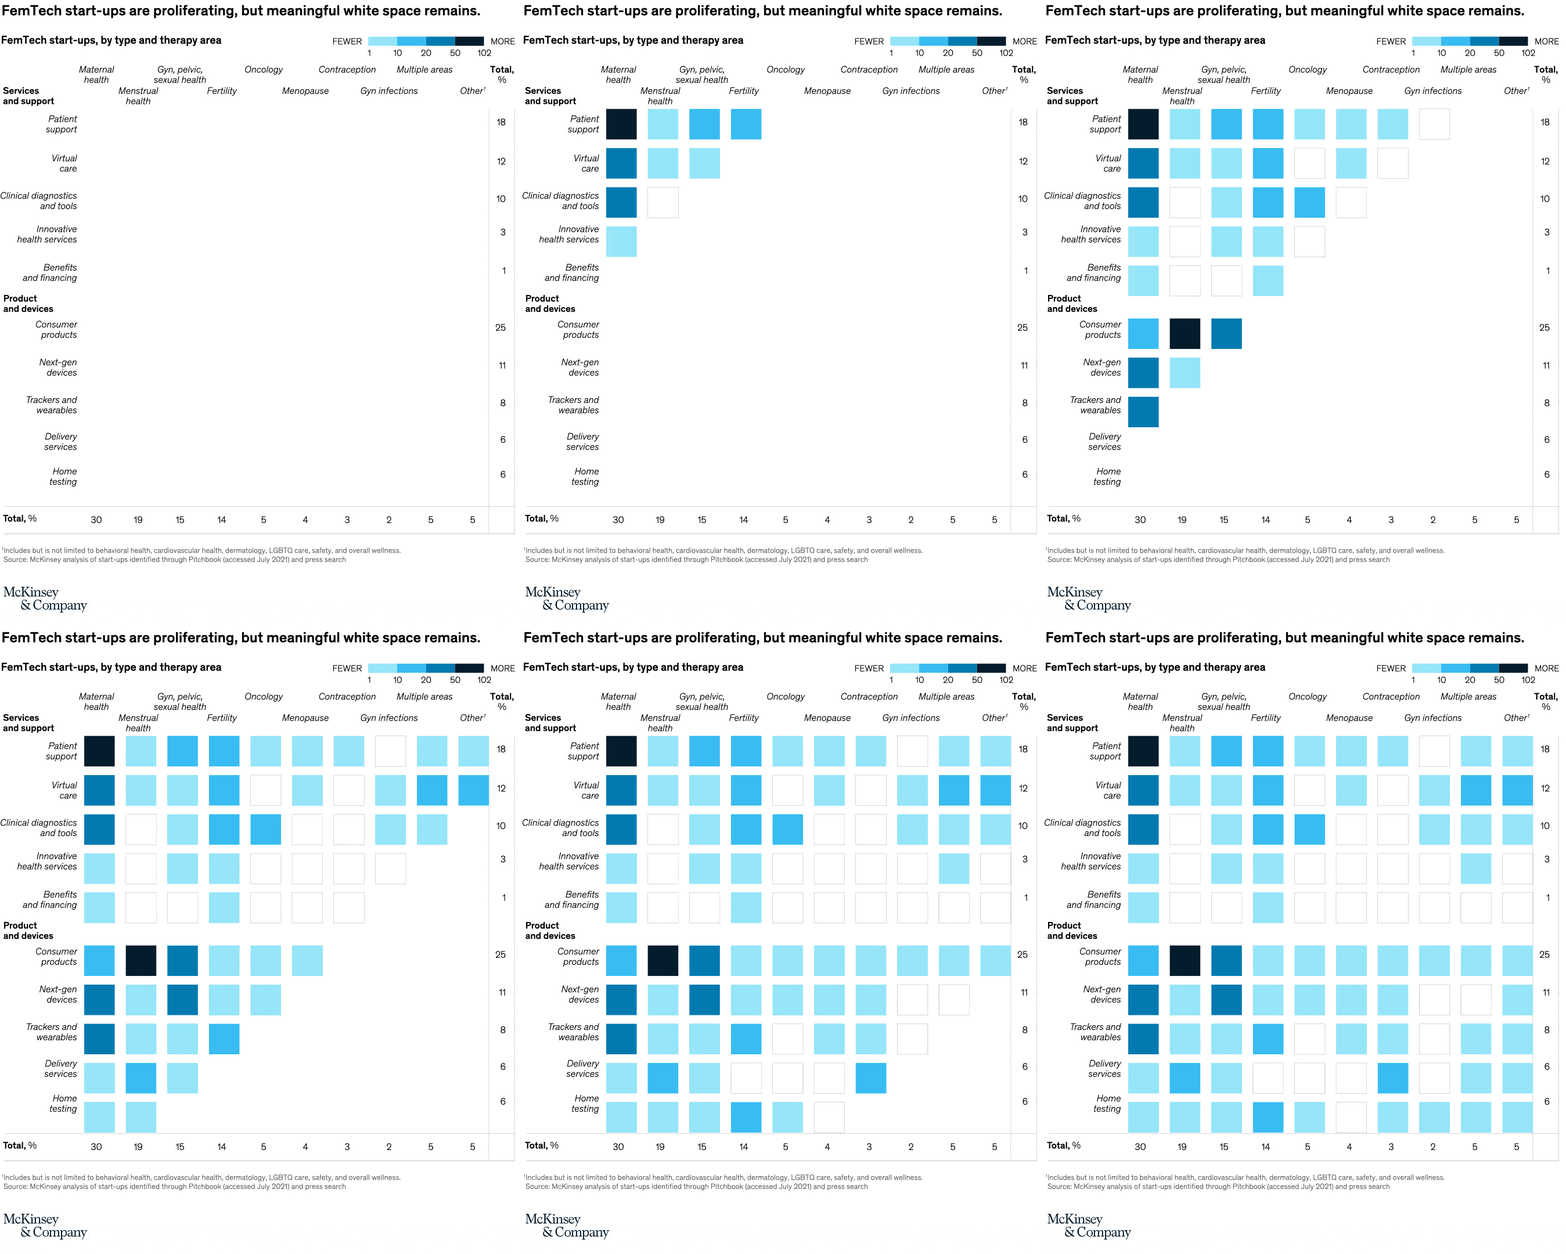
The chart is one large matrix with startup types running down the rows and therapy areas running across the columns, plus row totals on the right and column totals along the bottom. Read across a row to see where a startup type is concentrated, or read down a column to see which therapy areas attract the most start-up activity.
What is being compared
The matrix compares FemTech start-ups by both business type and therapy area. The rows separate services and support offerings from products and devices, and the columns span maternal health, menstrual health, gynecology and pelvic sexual health, fertility, oncology, menopause, contraception, gynecologic infections, multiple areas, and other categories.
Measurement system
Color intensity is the main scale, running from fewer start-ups in pale squares to more start-ups in darker squares. The rightmost numbers show row totals as percentages, and the bottom axis shows total share by therapy area, which lets the reader track both local concentrations and overall category weight.
Visible structure inside the graphic
The grid is divided into two row families, with services and support in the top half and products and devices in the bottom half. Darker clusters appear in specific cells rather than in an even blanket across the grid, while many blank or faint cells remain in less crowded therapy areas, which is what gives the matrix its white-space story.
Main takeaway from the visual
Start-up activity is clearly present, but it is not evenly spread across women’s health needs. The densest concentration sits in maternal health, menstrual health, gynecology and pelvic sexual health, and fertility, while menopause, contraception, gynecologic infections, and multi-area combinations remain much lighter and more open.
Key standout values or extremes
Across therapy areas, the largest shares are maternal health at 30 percent, menstrual health at 19 percent, gynecology and pelvic sexual health at 15 percent, and fertility at 14 percent. Across startup types, consumer products is the largest row at 25 percent, followed by patient support at 18 percent, virtual care at 12 percent, next-generation devices at 11 percent, and clinical diagnostics and tools at 10 percent; benefits and financing is the smallest row at 1 percent.
Controls / sequence, when applicable
This is a static chart image with no in-chart controls to operate.
Companion media, when applicable
There is no separate companion audio or video; the chart image is the full visual on this page.