Source page: McKinsey & Company
Commentary
What lies beneath retail's carbon emissions
Decarbonization | Sustainability | Supply Chain Management
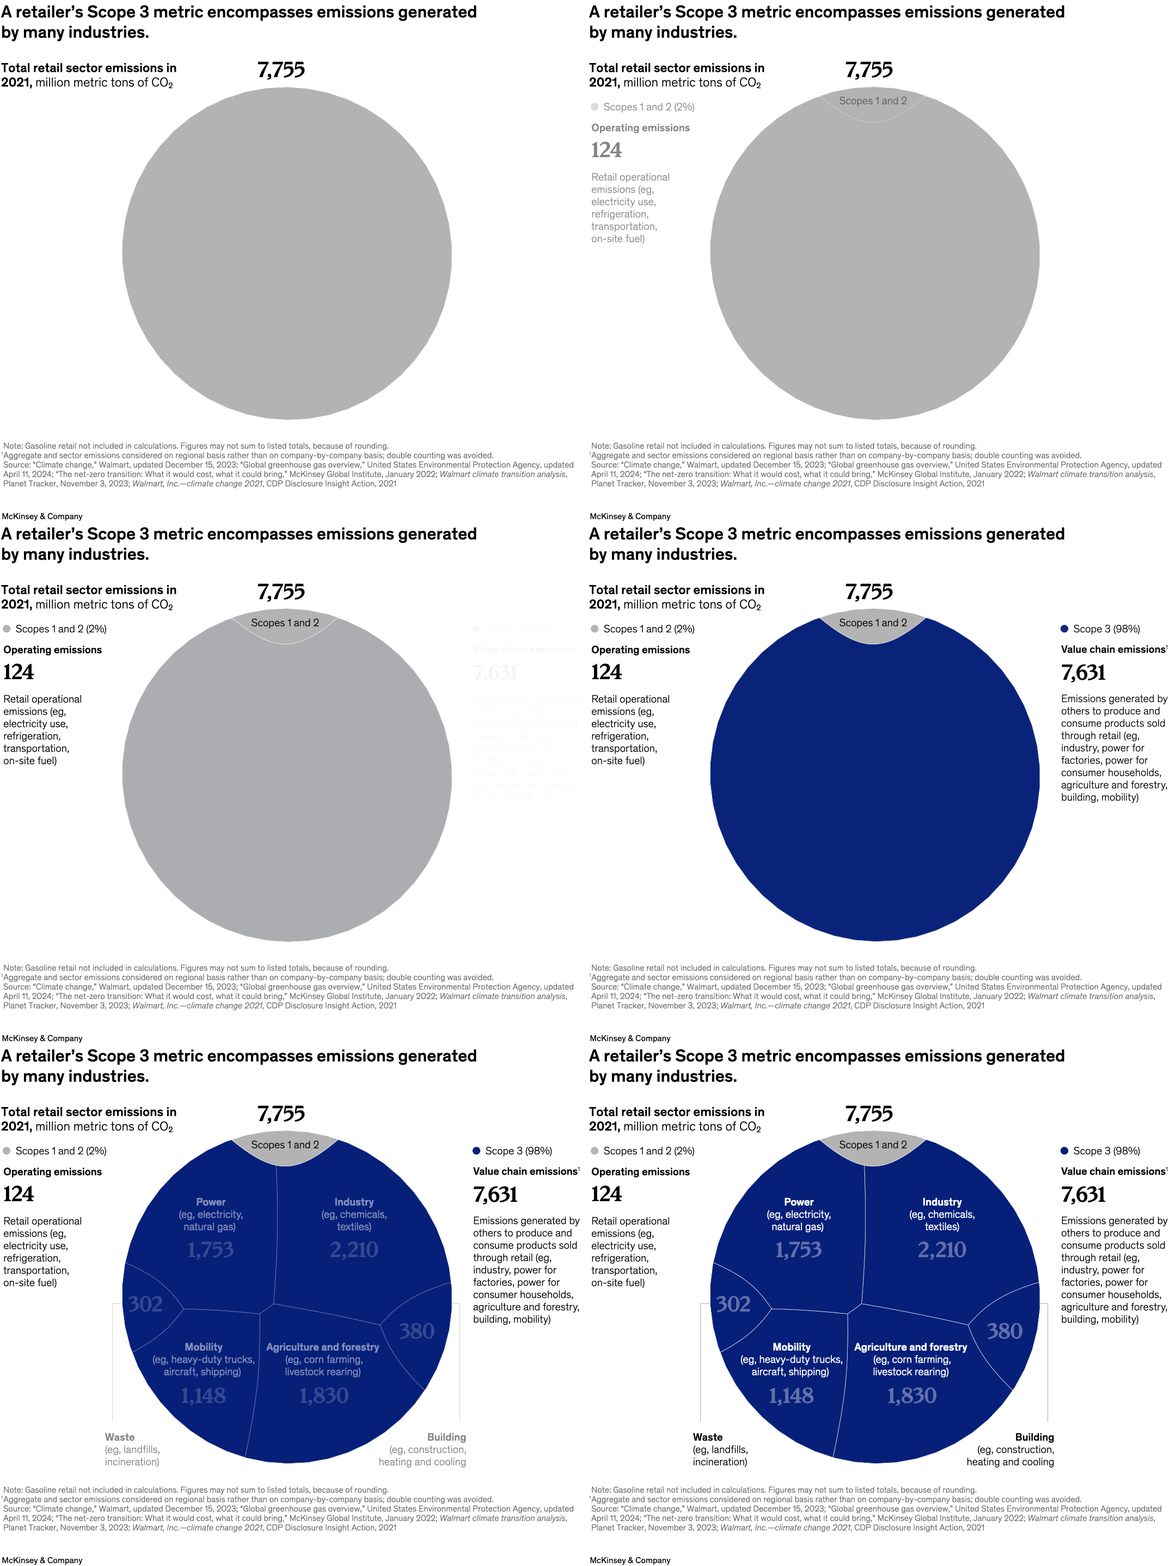
October 1, 2024 – The retail sector has a significant carbon footprint, but a relatively small portion of it comes from retailers’ own operations. Partner Peter Spiller and colleagues find that nearly 98 percent of a retailer’s total attributable emissions come from its value chain, encompassing activities such as power needs, agriculture and forestry, shipping, and waste, all of which are part of producing the products a retailer sells. This means that retailers have a major opportunity to reduce their environmental impact by working with their suppliers and customers to reduce emissions throughout the value chain.
To read the report, see “Retailers’ climate road map: Charting paths to decarbonized value chains,” July 31, 2024.
customizer here
Visual form
Partitioned circle chart.
Layout / body structure
The chart is centered on a large circular partition that divides total retail emissions into major source sectors, with explanatory callouts on the left and right. It is read from the overall total at the top into the circle’s large sector wedges and then outward to the side notes for Scopes 1 and 2 versus Scope 3.
What is being compared
It compares the retail sector’s total emissions in 2021 across operating emissions and value-chain emissions, and within the value chain it compares major upstream source sectors such as industry, agriculture and forestry, power, mobility, building, and waste.
Measurement system
The chart uses million metric tons of CO2. The overall total is printed above the circle, the scope split is labeled as 2 percent versus 98 percent, and the large sector wedges inside the circle carry their own tonnage labels.
Visible structure inside the graphic
A small gray cap at the top marks Scopes 1 and 2, while the much larger dark-blue body of the circle is divided into irregular sector wedges for Scope 3 sources. Side callouts explain the operating-emissions total on the left and the much larger value-chain total on the right.
Main takeaway from the visual
The visual makes it clear that retail emissions are overwhelmingly a Scope 3 problem rather than a direct operating-emissions problem. The giant value-chain area dominates the circle, and within that area the biggest wedges belong to industry, agriculture and forestry, and power.
Key standout values or extremes
Total retail emissions are labeled at 7,755 million metric tons of CO2, of which just 124 belong to Scopes 1 and 2 and 7,631 belong to Scope 3. Among the internal wedges, industry is the largest at 2,210, followed by agriculture and forestry at 1,830, power at 1,753, mobility at 1,148, building at 380, and waste at 302.
Controls / sequence, when applicable
This is a static chart image with no in-chart controls to operate.
Companion media, when applicable
There is no separate companion audio or video; the chart image is the full visual on this page.