Source page: McKinsey & Company
Commentary
What loyalty?
Retail | Consumer | Asia-Pacific
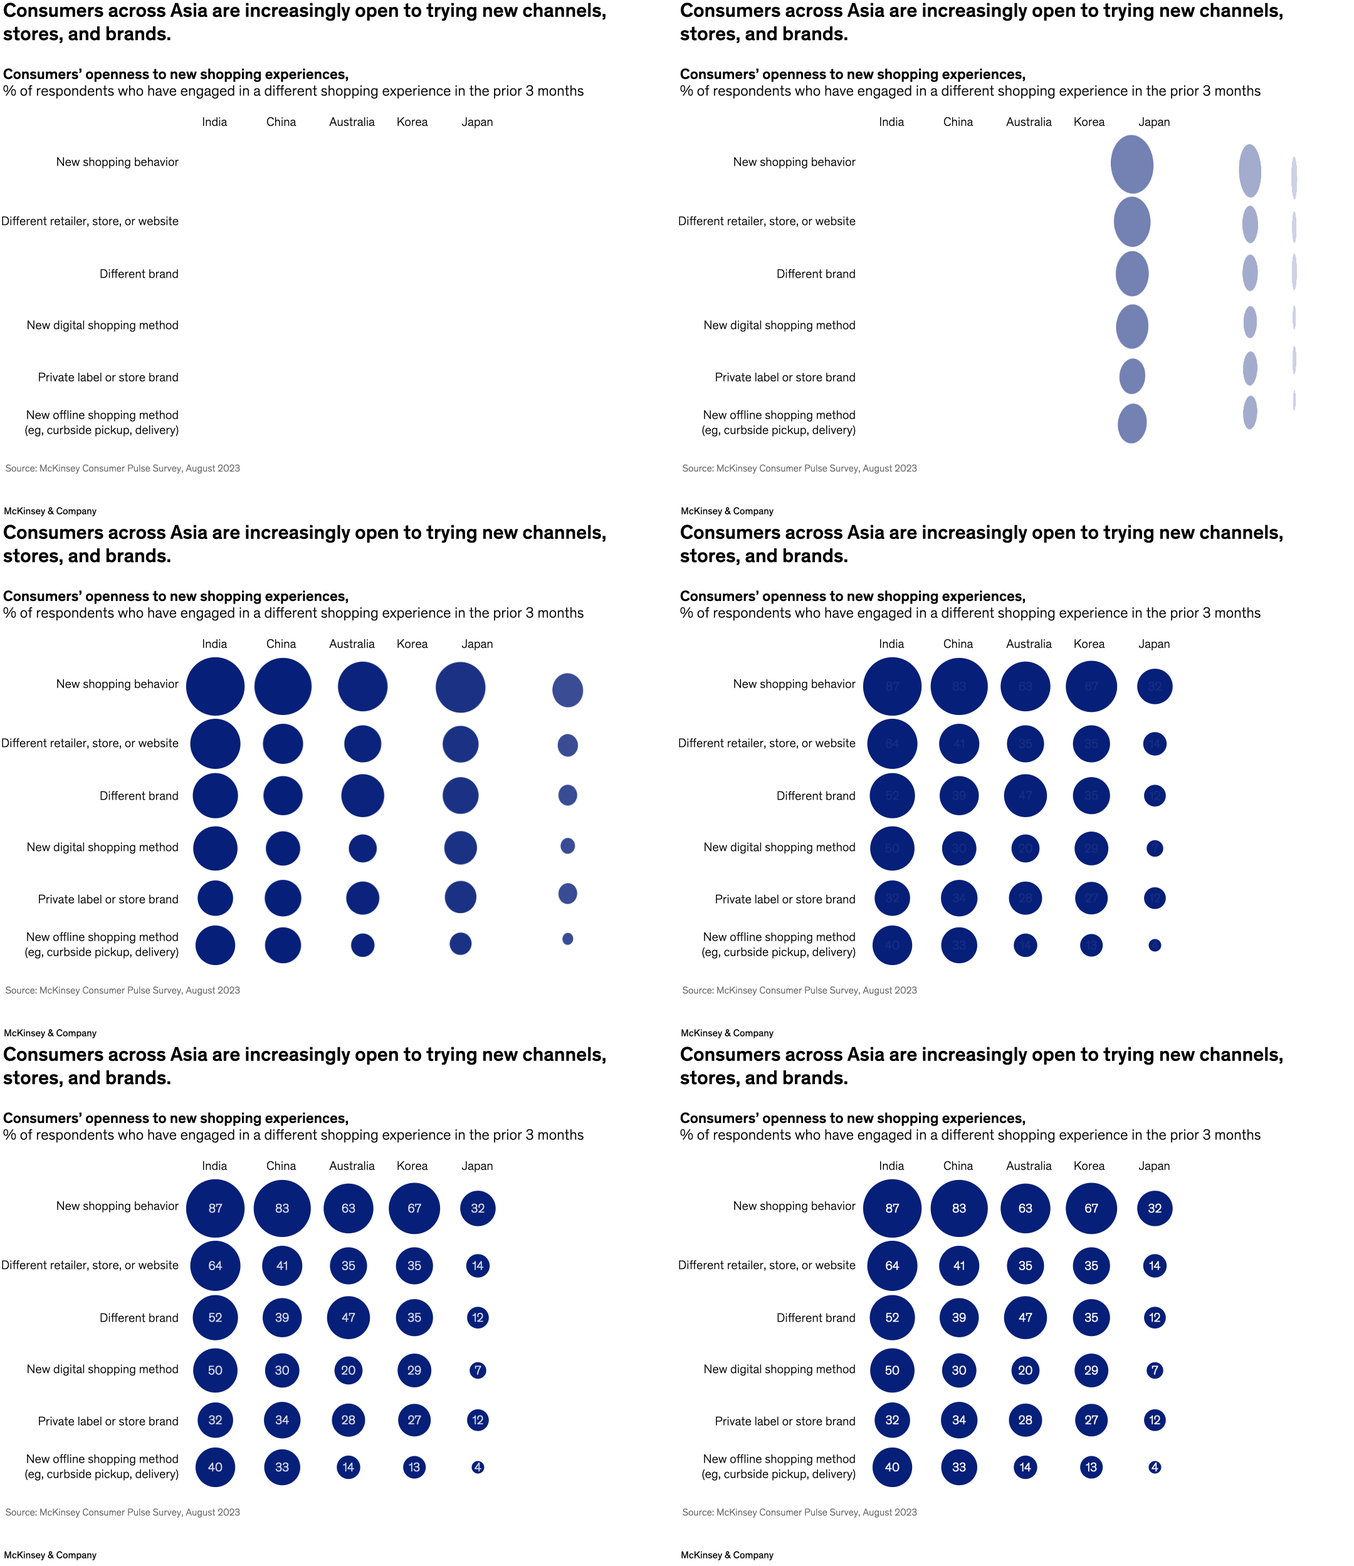
November 2, 2023 – The consumer in the Asia–Pacific region is quickly evolving—and brands would be wise to pay attention, explain senior partner Dymfke Kuijpers and coauthors. For instance, 63 percent of consumers surveyed in Australia said they had adopted new shopping behaviors—including shopping at different stores or buying different brands—in the prior three months. This figure is even higher in India (87 percent), China (83 percent), and South Korea (67 percent).
To read the article, see “‘Zero consumers’: What they want and why it matters,” October 18, 2023.
customizer here
Visual form
Bubble-matrix comparison. Each circle shows the share of consumers who tried a different shopping experience, with bubble size and printed value carrying the comparison across countries and behaviors.
Layout / body structure
The chart is arranged as a matrix with behavior types in the rows and countries in the columns. Reader scans left to right across India, China, Australia, Korea, and Japan, and top to bottom through new shopping behavior, different retailer, different brand, new digital shopping method, private label or store brand, and new offline shopping method.
What is being compared
The visual compares consumer openness to switching shopping experiences across Asia. It compares both country differences and behavior differences, showing which markets are most willing to try new channels, brands, and shopping methods.
Measurement system
The values are percentages of respondents who engaged in a different shopping experience in the prior three months. Each cell contains the exact percentage, and the bubble size scales up or down with that value so the reader can see high- and low-openness patterns at a glance.
Visible structure inside the graphic
The matrix uses one dark blue circle per country-behavior intersection, with larger circles clustered in the upper rows and much smaller circles lower down, especially in Japan. Because the same circular marks repeat through the whole grid, the chart reads like a clean ranking surface rather than a bar chart.
Main takeaway from the visual
Consumers across Asia are willing to try new shopping behaviors, but openness is strongest in India and China and weakest in Japan. The matrix makes that visible by showing the biggest circles concentrated in India and China across multiple behaviors and much smaller circles across nearly every row for Japan.
Key standout values or extremes
India leads the top row at 87 percent for new shopping behavior, followed by China at 83 percent and Korea at 67 percent. Japan is consistently the lowest, at 32 percent for new shopping behavior, 14 percent for a different retailer, 12 percent for a different brand, 7 percent for a new digital shopping method, and 4 percent for a new offline shopping method.
Controls / sequence, when applicable
This is a static chart image with no in-chart controls to operate.
Companion media, when applicable
There is no separate companion audio or video; the chart image is the full visual on this page.