Source page: McKinsey & Company
Commentary
What’s your (corporate-purpose) sweet spot?
Organization | Corporate purpose
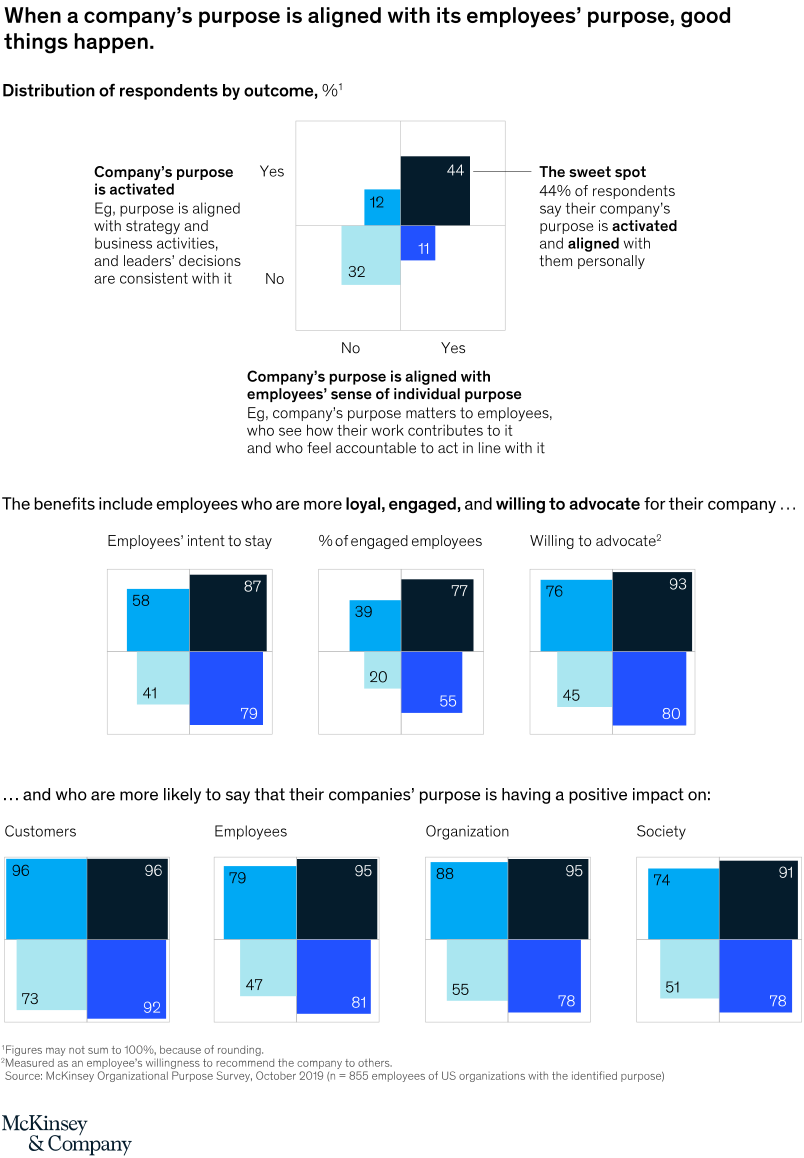
January 6, 2021 – When companies find that sweet spot where the “we” overlaps with the “me,” they, their employees, and even society greatly benefit. But that’s happening only 44 percent of the time right now.
To read the article, see “Purpose, not platitudes: A personal challenge for top executives,” December 3, 2020.
customizer here
Visual form
Quadrant matrix with companion tile comparisons.
Layout / body structure
The chart is arranged in three layers: a top 2-by-2 alignment matrix, a middle row of three outcome tiles, and a bottom row of four impact tiles. Read the top matrix first to identify the purpose sweet spot, then move downward through the two rows of tiled comparisons to see how outcomes change across the quadrants.
What is being compared
The chart compares whether a company’s purpose is activated and whether that purpose is aligned with employees’ sense of individual purpose. It then compares employee outcomes such as intent to stay, engagement, advocacy, and perceived impact on customers, employees, the organization, and society across the four resulting quadrants.
Measurement system
The measurement is percent of respondents. Each quadrant or tile uses printed percentages inside colored blocks, with the top matrix showing the share of respondents in each alignment outcome and the lower tiles comparing outcome levels for the four quadrants.
Visible structure inside the graphic
At the top, a 2-by-2 square is labeled Yes or No on both axes, with four colored blocks and a callout highlighting the 44 percent sweet spot where purpose is both activated and aligned. Below, the graphic repeats the same four-color quadrant logic inside three larger tiles for loyalty outcomes and four more tiles for impact outcomes, with numbers such as 87, 77, 93, 96, and 95 appearing in the highest-performing cells.
Main takeaway from the visual
The strongest employee and organizational outcomes cluster where company purpose is both activated and personally aligned with employees. The sweet-spot cell is not only the largest or most emphasized block at the top, but the matching color also dominates the highest values across the lower comparison tiles.
Key standout values or extremes
The top matrix shows 44 percent in the sweet spot, compared with 32 percent where purpose is neither activated nor aligned, 12 percent where it is activated but not aligned, and 11 percent where it is aligned but not activated. In the lower outcome tiles, the sweet-spot values reach 87 for intent to stay, 77 for engagement, 93 for willingness to advocate, and up to 96 or 95 for positive impact on customers, employees, and the organization.
Controls / sequence, when applicable
This is a static chart image with no in-chart controls to operate.
Companion media, when applicable
There is no separate companion audio or video; the chart image is the full visual on this page.