Source page: McKinsey & Company
Commentary
What’s your plan for climate resilience?
Sustainability | Climate change
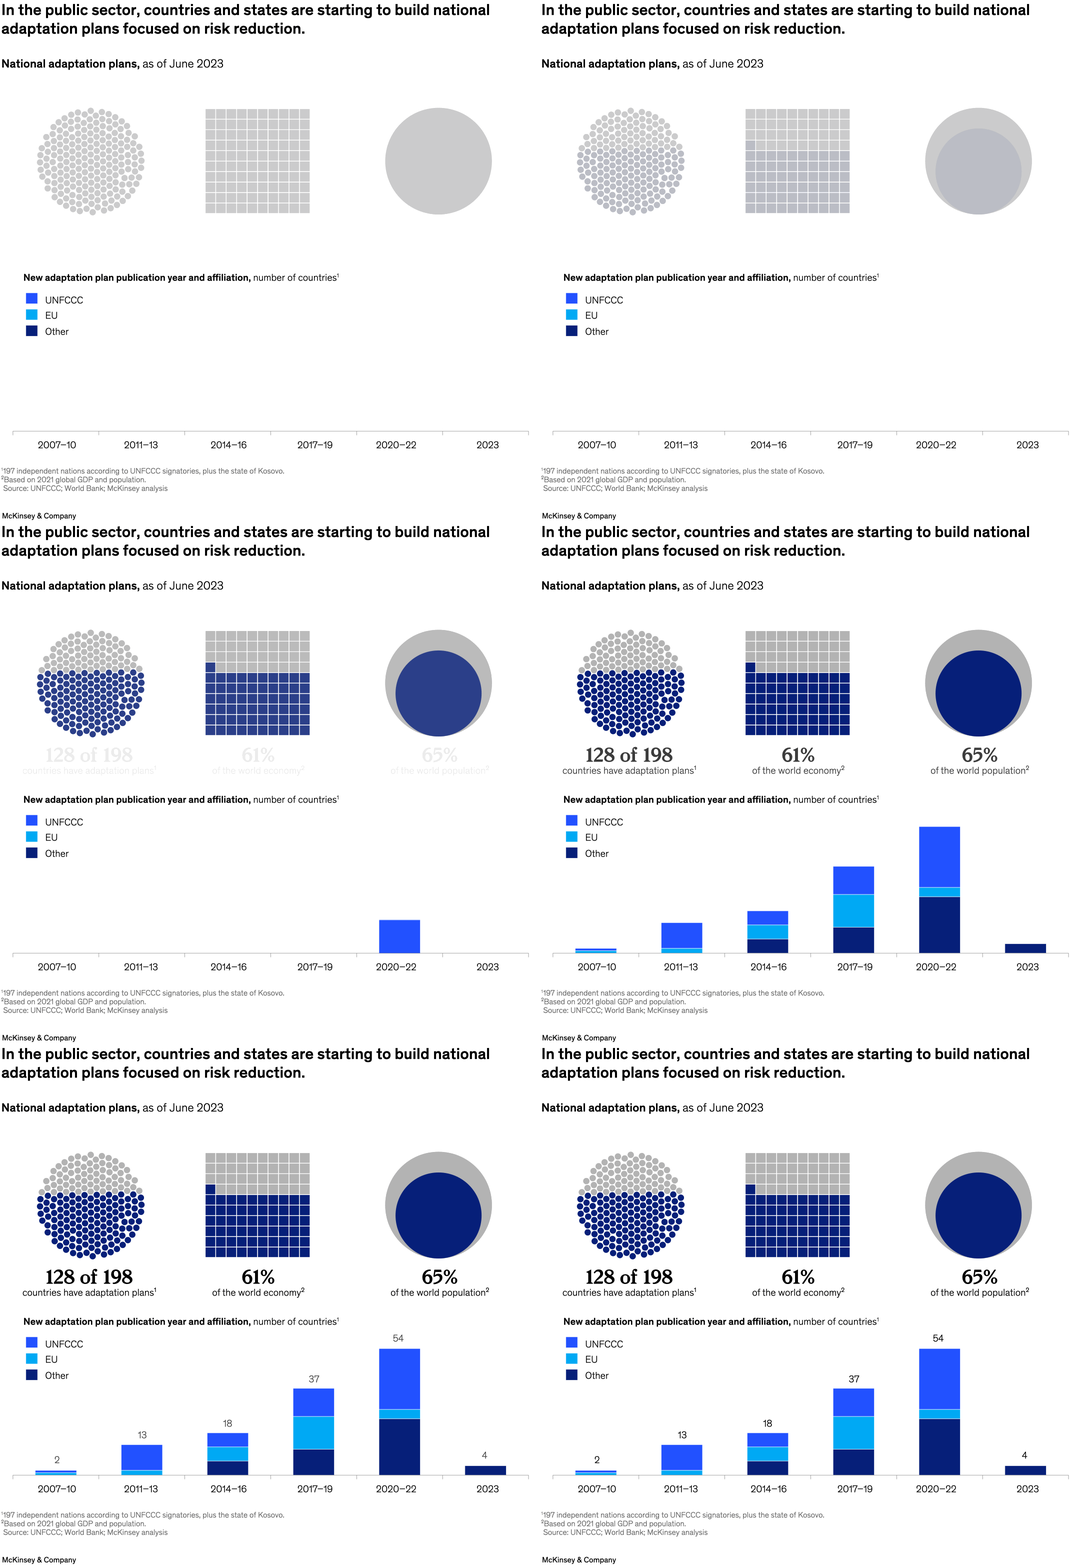
November 30, 2023 – Extreme weather events are becoming increasingly common around the world. As COP28, the United Nations’ annual climate change conference, kicks off, there’s an opportunity for the public sector to increase resilience for such events, note managing partner for global client capabilities Homayoun Hatami, senior partner Hamid Samandari, and colleagues. Approximately 65 percent of countries have developed a national climate adaptation plan—a sign of progress. To fortify and enable adaptation plans, governments and government agencies can consider a set of actions, such as setting goals based on a range of future climatic conditions and engaging private sector actors and investors to mobilize funding and promote innovation.
To read the article, see “Paving the way to resilience: Strengthening public sector adaptation planning and execution,” November 27, 2023.
customizer here
Visual form
Multi-panel infographic with summary callouts and a stacked bar chart. The page combines top-line adoption indicators with a lower time-based breakdown of when national adaptation plans were created.
Layout / body structure
The chart is read from top to bottom. Three headline callouts at the top summarize plan coverage, world-economy coverage, and world-population coverage, and the lower section uses stacked bars by time period to show when plans were adopted and by what affiliation grouping.
What is being compared
The visual compares how many countries have national adaptation plans, how much of the world economy and population those plans cover, and how adoption has accumulated across time and affiliation categories. It is therefore comparing both coverage breadth and timing of uptake.
Measurement system
The top callouts use counts and percentages, while the lower bars use the number of countries adopting plans in each period. Color in the stacked bars separates affiliation groups such as UNFCCC, EU, and other categories, making it possible to compare not just when plans were adopted but who the adopters were.
Visible structure inside the graphic
The top section uses three large visual tokens with the values 128, 61 percent, and 65 percent. The lower section contains a set of stacked bars across adoption windows from 2000 to 2013 through 2023, with the largest bar appearing in the 2020 to 2022 period and smaller bars at the beginning and end of the timeline.
Main takeaway from the visual
National adaptation planning has become much more widespread, but the build-out is still incomplete and heavily concentrated in the more recent years. The top-line callouts establish broad global coverage, while the lower bars show that the surge in plan creation comes mainly in the later adoption windows.
Key standout values or extremes
The chart states that 128 of 198 countries have adaptation plans, covering 61 percent of the world economy and 65 percent of the world population. In the lower timeline, the 2020 to 2022 bar is the tallest at 54 countries, far above the earliest adoption periods.
Controls / sequence, when applicable
This is a static chart image with no in-chart controls to operate.
Companion media, when applicable
There is no separate companion audio or video; the chart image is the full visual on this page.