Source page: McKinsey & Company
Commentary
When two plus two does not equal four
Remote learning
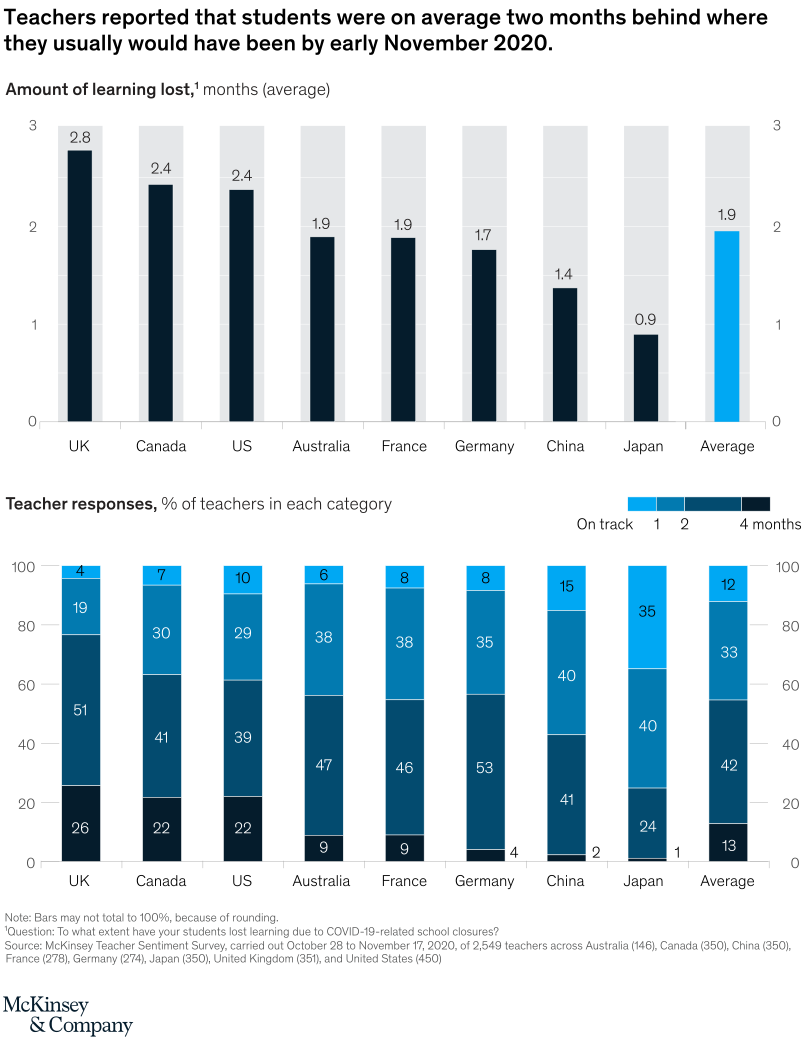
April 1, 2021 – Just 2 percent of teachers in two countries (China and Japan) said their students are four months behind schedule. In our survey, many more Canadian, UK, and US teachers said that their students were lagging by four months.
To read the article, see “Teacher survey: Learning loss is global—and significant,” March 1, 2021.
customizer here
Visual form
Two-part country comparison chart combining a bar row and stacked columns.
Layout / body structure
The chart starts with a top row of country bars showing average months of learning lost, then drops to a lower row of stacked percentage columns for the same countries. Reader compares the average-loss bars first and then uses the lower stacks to see how teacher responses are distributed across months-behind categories.
What is being compared
It compares countries on reported student learning loss by early November 2020. The top panel compares the average months behind in the UK, Canada, the US, Australia, France, Germany, China, Japan, and the cross-country average, while the lower panel compares the distribution of teacher responses across on track, one month, two months, and four months behind.
Measurement system
The top measure is months of learning lost, printed directly above each bar. The lower measure is percent of teachers in each response category, shown as 100 percent stacked columns with segment values printed inside the bands.
Visible structure inside the graphic
The top bars sit against a common 0 to 3 month background, which makes the highest-loss countries stand out quickly. The lower panel repeats the same stacked structure across all countries, letting the eye compare where darker long-loss categories dominate and where lighter short-loss categories take a larger share.
Main takeaway from the visual
Teachers across countries reported meaningful learning loss, with students on average about two months behind and some countries substantially worse. The lower stacks show that large shares of teachers place students two to four months behind rather than merely slightly off track.
Key standout values or extremes
The top panel shows the UK at 2.8 months behind, Canada and the US at 2.4, Australia and France at 1.9, Germany at 1.7, China at 1.4, Japan at 0.9, and the overall average at 1.9. In the lower panel, the UK has 26 percent in the four-month category and 51 percent in the two-month category, Germany has 53 percent in the two-month band, and Japan has the largest on-track share at 35 percent.
Controls / sequence, when applicable
This is a static chart image with no in-chart controls to operate.
Companion media, when applicable
There is no separate companion audio or video; the chart image is the full visual on this page.