Source page: McKinsey & Company
Commentary
White employees: there’s both trust and respect in our workplace. Black employees: not really
Organization | Diversity & Inclusion
May 7, 2021 – Black employees also don’t feel that they can be their full selves at work, and that the system for evaluation and promotion is fair. These findings from our 2021 Race in the Workplace Survey point to a substantial trust deficit between companies and their Black employees.
To read the article, see “The Black experience at work in charts,” April 15, 2021.
customizer here
Visual form
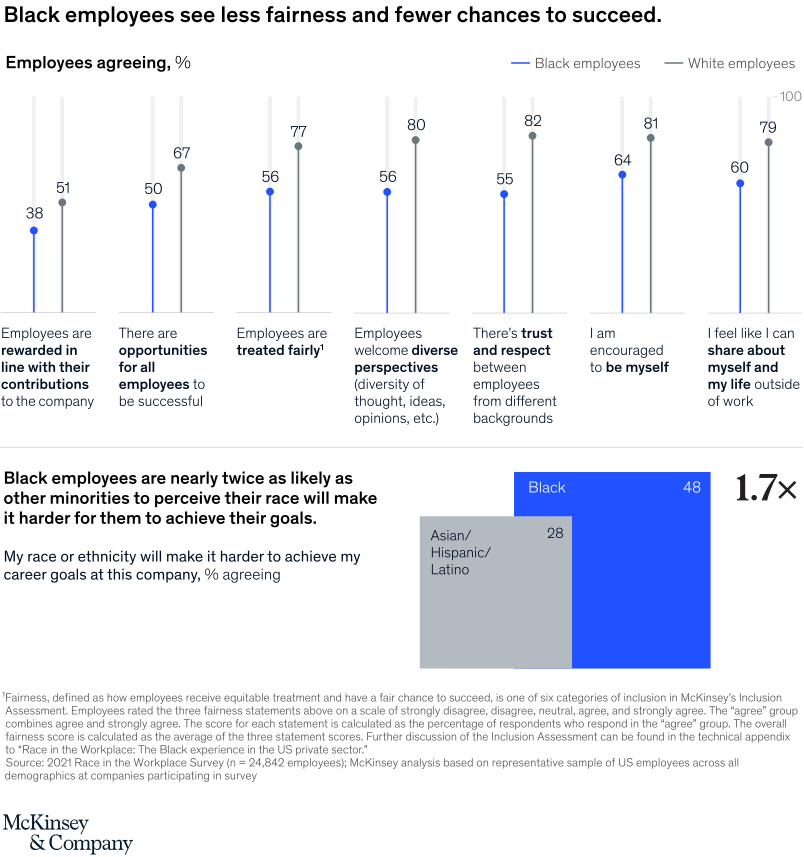
Two-part comparison chart combining a paired lollipop panel and a bar-comparison panel.
Layout / body structure
The chart starts with a top row of seven paired lollipop comparisons running left to right across inclusion statements, then drops to a lower panel that compares how often race is perceived as a barrier to achieving career goals. Reader scans the seven top statements first and then uses the lower bar panel as the summary of the hardest downstream consequence.
What is being compared
It compares Black employees with White employees on seven workplace inclusion measures, including rewards, opportunity, fairness, welcome for diverse perspectives, trust and respect, encouragement to be oneself, and comfort sharing about life outside work. The lower panel then compares Black employees with Asian, Hispanic, and Latino employees on agreement that race or ethnicity will make career goals harder to achieve.
Measurement system
The measure throughout is percent agreeing. In the top section, each statement has two labeled endpoints for Black employees and White employees; in the lower section, the bars print 48 and 28 and add a 1.7 times callout to quantify the gap.
Visible structure inside the graphic
The upper half repeats the same paired-vertical format seven times, with blue for Black employees and gray for White employees, so every gap can be judged on the same scale. The lower half switches to large rectangular bars and a bold ratio callout, which turns the abstract inclusion shortfall into a concrete consequence around advancement.
Main takeaway from the visual
Black employees score lower than White employees on every inclusion statement shown, and they are also much more likely to believe race will make it harder to achieve career goals. The chart makes the pattern look systemic because the top panel never reverses and the lower panel widens the story into a clear barrier gap.
Key standout values or extremes
The top-panel gaps include 38 versus 51 on being rewarded in line with contributions, 50 versus 67 on opportunities for all employees to be successful, 56 versus 77 on being treated fairly, 56 versus 80 on welcome for diverse perspectives, 55 versus 82 on trust and respect, 64 versus 81 on being encouraged to be oneself, and 60 versus 79 on comfort sharing about life outside work. In the lower panel, 48 percent of Black employees versus 28 percent of Asian, Hispanic, and Latino employees say race or ethnicity will make their goals harder, which is marked as a 1.7-times difference.
Controls / sequence, when applicable
This is a static chart image with no in-chart controls to operate.
Companion media, when applicable
There is no separate companion audio or video; the chart image is the full visual on this page.