Source page: McKinsey & Company
Commentary
Widespread COVID-19 testing is correlated with fewer cases
COVID-19 | Public Health
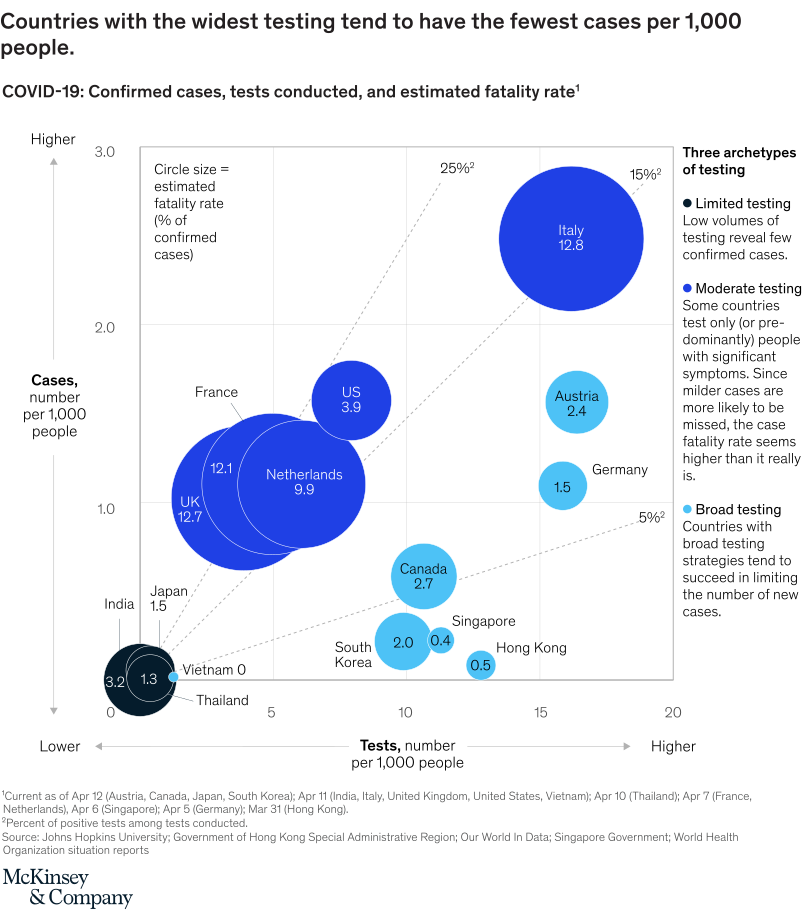
May 5, 2020 – Countries need to think about building surge capacity in traditional public-health approaches to control the virus’s spread—disease surveillance, contact tracing, and targeted quarantines. Such a surge must build on current efforts to scale viral testing rapidly, mostly through reverse transcription-polymerase chain reaction machines. That’s because—in a somewhat surprising relationship—countries that have tested more people have diagnosed fewer cases per thousand people. To detect and control flare-ups quickly, widespread access to viral testing will become increasingly important as countries and cities prepare to relax distancing measures. In some countries, this testing capacity could be paired with at-scale contact tracing, embedded with privacy by design, and with quarantine facilities to help localize hot spots and prevent a broader resurgence.
To read the article, see “COVID-19: Briefing note, April 13, 2020,” April 2020.
customizer here
Visual form
Scatter Plot: bubble scatter plot of COVID-19 testing intensity, case burden, and fatality rate by country.
Layout / body structure
Countries are plotted in one field. The horizontal axis shows tests per 1,000 people, the vertical axis shows confirmed cases per 1,000 people, and each country is labeled near its bubble. Dotted guide lines and notes divide the field into testing archetypes.
What is being compared
It compares countries by how broadly they tested for COVID-19 and how many confirmed cases they had per person. Bubble size adds a third comparison: estimated fatality rate among confirmed cases.
Measurement system
The x-axis is tests per 1,000 people, the y-axis is cases per 1,000 people, and bubble area represents estimated fatality rate as a percent of confirmed cases. The chart therefore combines position and bubble size in one scatter plot.
Visible structure inside the graphic
Limited-testing countries cluster toward the left, moderate-testing countries sit in the middle, and broad-testing examples extend to the right. Several broad-testing places sit lower on the case axis, while Italy appears high on the case axis with a large fatality-rate bubble.
Main takeaway from the visual
The chart makes the relationship visible: countries that tested more broadly tended to report fewer cases per 1,000 people. It supports the argument that testing capacity is part of outbreak control, not just measurement after the fact.
Key standout values or extremes
Italy is the most prominent high-case, high-fatality bubble, labeled around 12.8. Hong Kong appears far to the right and low on the case axis, near 0.5 cases per 1,000 people, while Singapore and South Korea also sit on the broad-testing side.
Controls / sequence, when applicable
This is a static scatter plot; there are no in-chart controls to operate.
Companion media, when applicable
There is no separate companion audio or video; the bubble scatter plot is the full visual on this page.