Source page: McKinsey & Company
Commentary
Will consumers pay more for EVs?
Automotive | Consumer | Electric vehicles
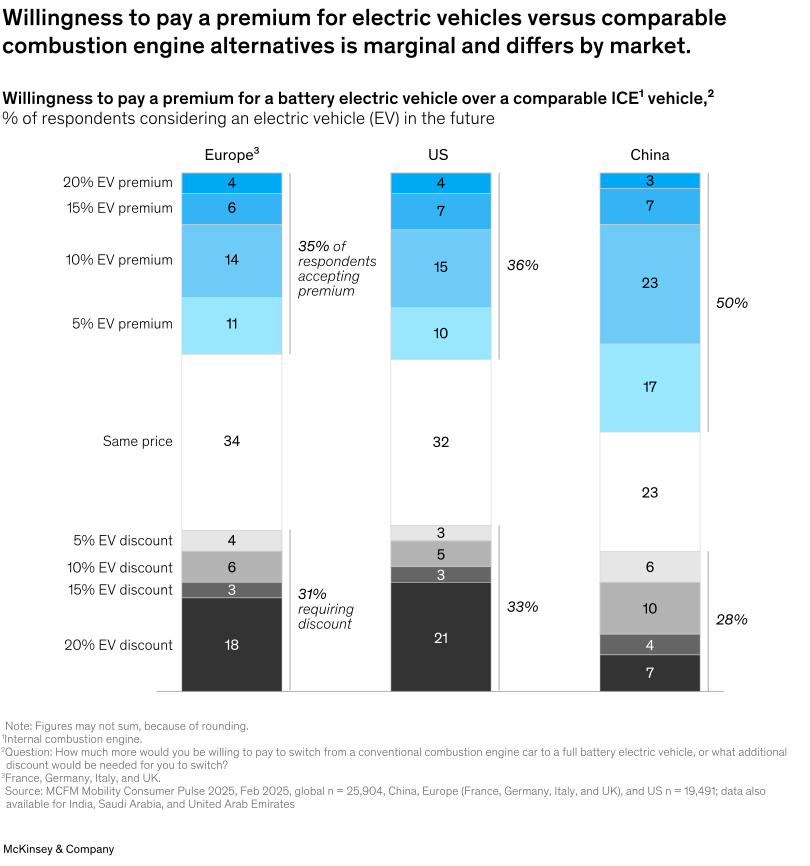
May 22, 2025 – Despite the ongoing increase in market share for electric vehicles (EVs), sales growth has slowed in many regions after years of rapid expansion. Consumer behavior is one important piece of the EV adoption puzzle, say Senior Partner Philipp Kampshoff and coauthors. Our annual mobility survey revealed that the price difference between comparable internal combustion engine (ICE) vehicles and battery electric vehicles (BEV) factors into purchasing decisions. In Europe and the United States, only about a third of respondents say they would accept a BEV premium.
To read the article, see “New twists in the electric-vehicle transition: A consumer perspective,” April 22, 2025.
customizer here
Visual form
Segmented stacked column chart. The chart uses three vertical market columns split into premium, same-price, and discount bands for battery electric vehicles relative to comparable combustion vehicles.
Layout / body structure
The chart is a single side-by-side market comparison with one column each for Europe, the United States, and China. Each column is read vertically from the discount tiers at the bottom through the same-price middle band up to the premium tiers at the top, with summary percentages printed to the right of each market stack.
What is being compared
The visual compares consumer willingness to pay more, pay the same, or require a discount for a battery electric vehicle across Europe, the United States, and China. Within each market, it also compares the size of the premium or discount people say they would accept, using separate bands for 5, 10, 15, and 20 percent intervals.
Measurement system
Everything is expressed as a percentage of respondents considering an electric vehicle in the future. The chart uses stacked shares rather than axis labels, and the totals for premium acceptance and discount requirement are called out beside each market column.
Visible structure inside the graphic
Each market column has blue premium bands above, a white same-price block in the middle, and gray discount bands below. The premium tiers are labeled 5, 10, 15, and 20 percent EV premium, the discount tiers are labeled 5, 10, 15, and 20 percent EV discount, and the total premium and discount shares are shown as side annotations next to each full stack.
Main takeaway from the visual
The visible takeaway is that willingness to pay an EV premium is limited in Europe and the United States and meaningfully stronger in China. At the same time, a large minority in every market still wants price parity or a discount, which shows how constrained EV pricing power remains even in the stronger market.
Key standout values or extremes
China has the largest premium-accepting share at 50 percent, compared with 35 percent in Europe and 36 percent in the United States. Europe shows 34 percent willing to pay the same price and 31 percent requiring a discount, the United States shows 32 percent at the same price and 33 percent requiring a discount, and China shows 23 percent at the same price and 28 percent requiring a discount.
Controls / sequence, when applicable
This is a static chart image with no in-chart controls to operate.
Companion media, when applicable
There is no separate companion audio or video; the chart image is the full visual on this page.