Source page: McKinsey & Company
Commentary
Wings of change needed
Aerospace | Travel & Transportation
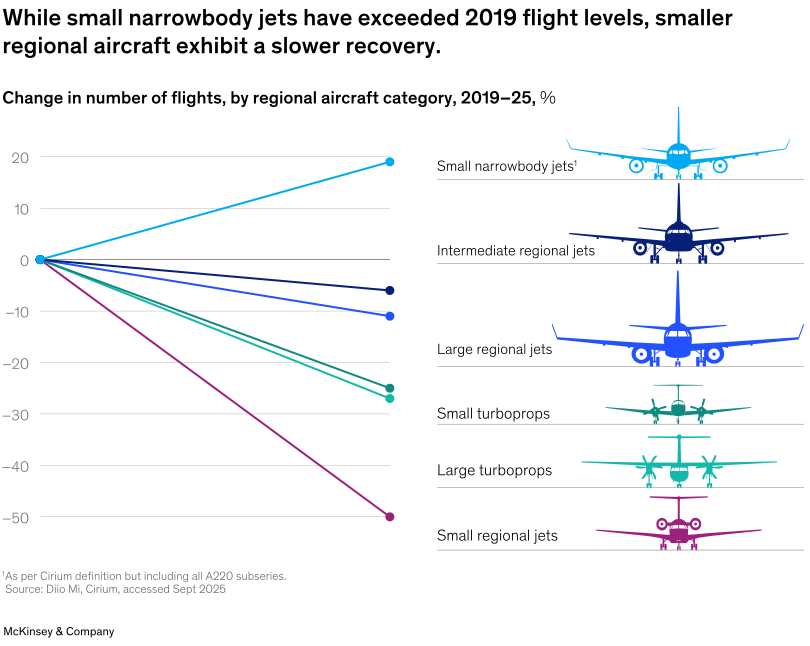
December 2, 2025 – The regional aviation segment, which handles short-haul flights and uses smaller aircraft, provides 11 percent of total commercial aviation seats. Despite its significance, regional aviation has lagged behind in postpandemic recovery compared with other parts of the industry, say Partner Daniel Riefer and coauthors. Small narrowbody jets have fully recovered, with 19 percent more flights in 2025 than in 2019, but service using smaller regional aircraft and turboprops have had the slowest recovery, possibly due to pilot shortages, aging fleets, and limited manufacturer investment. Despite uneven recovery, emerging technologies, new business models, and evolving network strategies could reinforce the role of regional aviation within the global aviation ecosystem.
To read the article, see “Small planes, big changes: The evolving business of regional aviation,” October 16, 2025.
customizer here
Visual form
Line chart with a side breakout of aircraft categories illustrated by plane silhouettes.
Layout / body structure
The page uses a two-column layout that reads left to right: the left side is the plotting area for the change in flights, and the right side is a labeled category column with horizontal guides and aircraft icons aligned to each end point.
What is being compared
It compares how different regional aircraft categories changed in flight activity between 2019 and 2025, separating small narrowbody jets from several regional-jet and turboprop classes.
Measurement system
The vertical scale is percent change in number of flights, with zero as the baseline and negative values showing categories still below 2019 levels. Color is used to separate each aircraft class, and the right-hand labels tie each line to its matching aircraft type.
Visible structure inside the graphic
All six colored lines start together at zero on the left and fan out to different end points on the right. The right column lists each aircraft class on its own horizontal rule and pairs it with a matching plane silhouette, making the endpoint ranking easy to read.
Main takeaway from the visual
The recovery is uneven: small narrowbody jets are above their pre-2019 level, while the smaller regional categories are still below it, and the smallest regional jets are trailing by the widest margin.
Key standout values or extremes
The small narrowbody line finishes near +19 percent, while intermediate regional jets end near -6 percent, large regional jets near -11 percent, small turboprops near -25 percent, large turboprops near -27 percent, and small regional jets around -50 percent.
Controls / sequence, when applicable
This is a static chart image with no in-chart controls to operate.
Companion media, when applicable
There is no separate companion audio or video; the chart image is the full visual on this page.