Source page: McKinsey & Company
Commentary
With patients come great rewards
Healthcare | Innovation
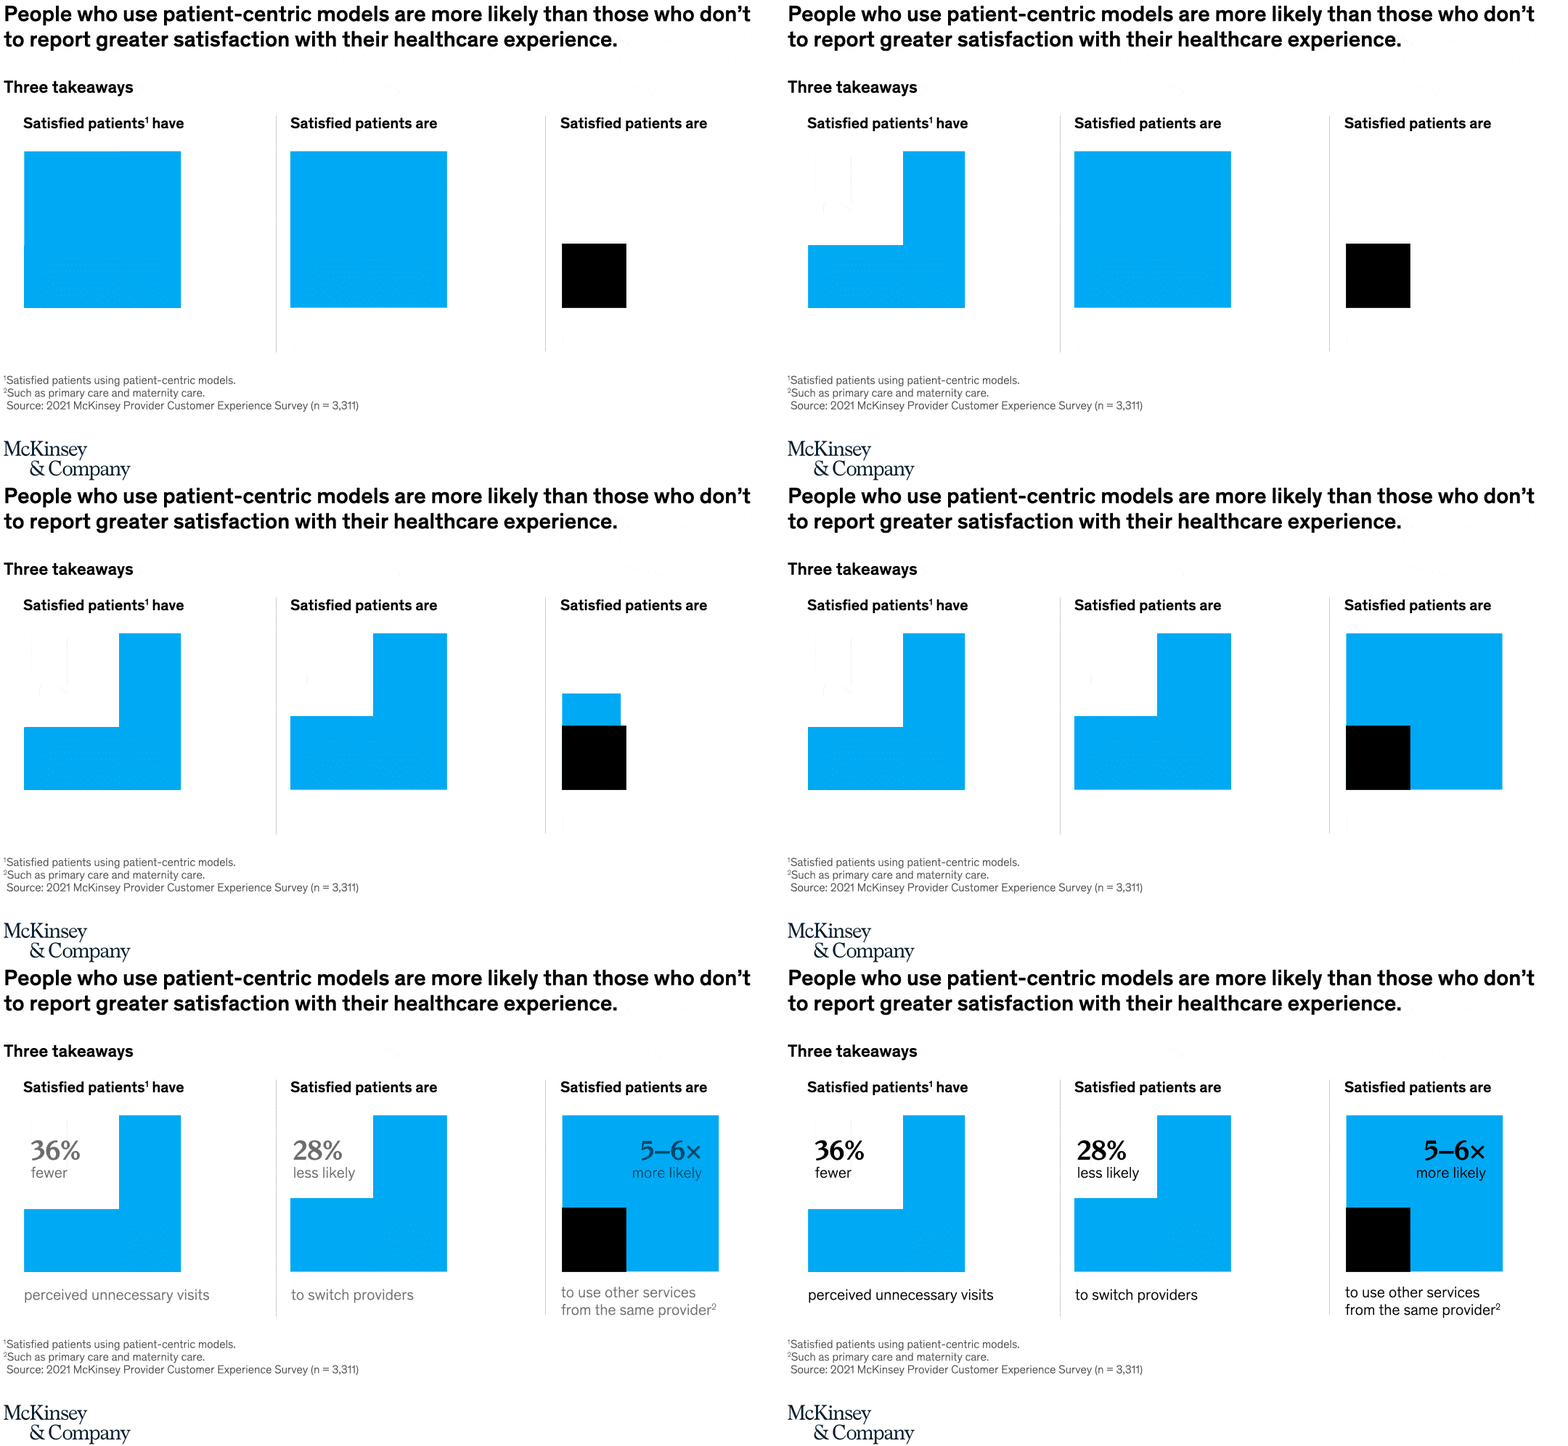
April 27, 2022 – Patient-centric healthcare models are meant to be convenient, transparent, and personalized—and they often lead to more satisfied consumers. According to our recent survey, satisfied patients who use patient-centric models are 28 percent less likely than those who don’t to switch providers and are five to six times more likely to use other services from that provider.
To read the article, see “The next frontier of care delivery in healthcare,” March 24, 2022.
customizer here
Visual form
Three-panel takeaway infographic with comparison blocks.
Layout / body structure
The chart is arranged as three equal panels across the page under one headline. Read the panels left to right, because each one states a separate patient-centric payoff with its own oversized number and a simple block graphic beneath it.
What is being compared
The page compares patient outcomes for people using patient-centric care models against those who do not. It compares unnecessary visits, likelihood of switching providers, and likelihood of using additional services from the same provider.
Measurement system
The first two panels express relative reductions as percentages, while the third expresses a lift as a multiple. The large numeric labels carry the core measure, and the block graphics work as supporting emphasis rather than as scaled axes with tick marks.
Visible structure inside the graphic
Each column pairs a short sentence with one large number and one simplified blue-and-black block shape. The third panel adds a black inset inside a larger blue field to show the contrast between baseline use and a much higher use of other services, while the first two keep the shapes simpler and more schematic.
Main takeaway from the visual
All three panels point in the same direction: patient-centric models are associated with more satisfied patients and more favorable business outcomes. The visual message is strongest in the third panel, where the multiple rather than a small percentage shift makes the gain look dramatically larger than the reductions shown in the first two.
Key standout values or extremes
Satisfied patients have 36 percent fewer perceived unnecessary visits and are 28 percent less likely to switch providers. The strongest effect on the page is the rightmost panel, which says satisfied patients are five to six times more likely to use other services from the same provider.
Controls / sequence, when applicable
This is a static chart image with no in-chart controls to operate.
Companion media, when applicable
There is no separate companion audio or video; the chart image is the full visual on this page.