Source page: McKinsey & Company
Commentary
Women are feeling more pressure at work due to the COVID-19 crisis than men are
Inequality | Diversity & Inclusion
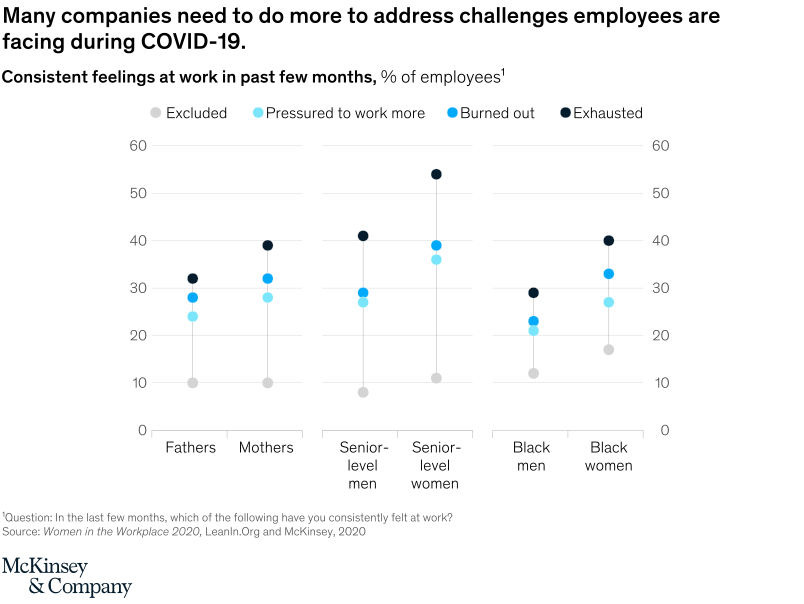
October 2, 2020 – Despite companies’ efforts to support employees during the crisis, women are feeling more exhausted, burned out, and under pressure than men, according to the latest Women in the Workplace study from LeanIn.Org and McKinsey. This suggests companies need to do more to adjust the norms and expectations that lead to these feelings
To read the article, see “Women in the Workplace 2020,” September 30, 2020.
customizer here
Visual form
Grouped survey bar chart.
Layout / body structure
The chart is a single comparison chart organized by workplace-pressure categories. Read it category by category, comparing the women and men bars within each group.
What is being compared
The chart compares women and men on several COVID-19-era work experiences, including feeling exhausted, burned out, under pressure to work more, and needing to stay always on.
Measurement system
The measure is survey share in percent for each feeling or pressure category. The repeated gender pairing lets the reader compare the two groups on the same question.
Visible structure inside the graphic
Each pressure-related topic appears as its own grouped comparison, with women’s responses set beside men’s. The layout makes the chart a row of repeated gender gaps rather than a single one-off difference.
Main takeaway from the visual
The chart shows that women are experiencing more sustained workplace strain than men across several closely related measures at once. The gaps are not limited to one burnout indicator; they run across exhaustion, pressure, and always-on expectations.
Key standout values or extremes
The strongest visual pattern is that the women’s bar is higher than the men’s bar in each major pressure category. The chart is built to show a repeated gap, not a single isolated outlier.
Controls / sequence, when applicable
This is a static chart image with no in-chart controls to operate.
Companion media, when applicable
There is no separate companion audio or video; the chart image is the full visual on this page.