Source page: McKinsey & Company
Commentary
Women investors on the rise
Diversity & Inclusion | Wealth management | Financial services
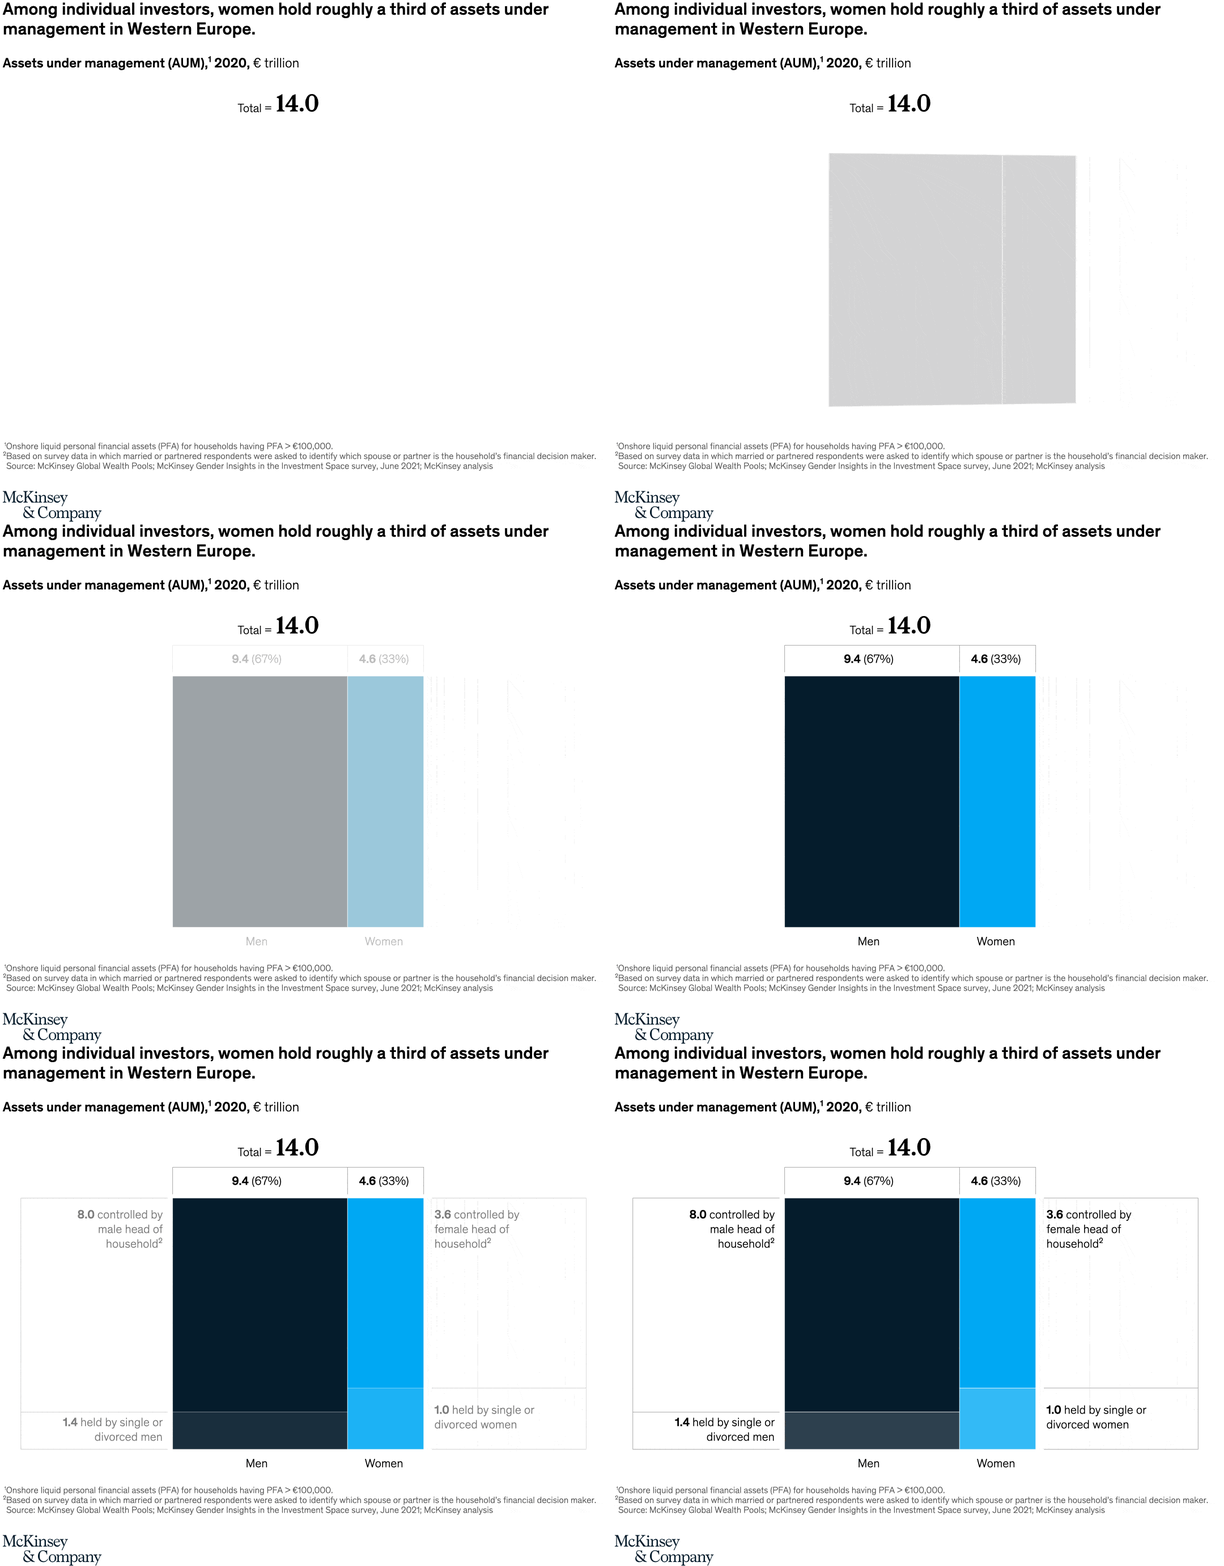
September 14, 2022 – Women investors in Western Europe control roughly a third of total assets under management (AUM), at about €4.6 trillion. With more women taking responsibility for household financial decisions, their shares in AUM are projected to grow to 45 percent by 2030 to €10 trillion. This shift requires wealth managers to adeptly accommodate new investment needs and behaviors.
To read the article, see “Wake up and see the women: Wealth management’s underserved segment,” June 23, 2022.
customizer here
Visual form
Column chart.
Layout / body structure
The page uses a single chart in the main visual slot, read from the current-state comparison into the forward projection and then down to the note beneath it.
What is being compared
The chart compares women’s share of wealth under management in Western Europe today with the larger share projected for 2030, tying that change to a broader shift in financial decision-making.
Measurement system
The reader is tracking both asset values and share of total AUM, so the chart combines euro-denominated scale with percentage share of the market.
Visible structure inside the graphic
The graphic is organized as a present-versus-future comparison, likely with columns or grouped bars showing both the size of assets and the share women control within total AUM.
Main takeaway from the visual
The chart shows women investors moving from an important segment to a much larger force in the wealth-management market, making the growth hard to dismiss as marginal.
Key standout values or extremes
The strongest anchored values on the page are the current EUR 4.6 trillion controlled by women investors in Western Europe, roughly one-third of AUM today, and the projection to 45 percent and EUR 10 trillion by 2030.
Controls / sequence, when applicable
This is a static chart image with no in-chart controls to operate.
Companion media, when applicable
There is no separate companion audio or video; the chart image is the full visual on this page.