Source page: McKinsey & Company
Commentary
Women leaders continue to feel the burn of burnout
Diversity & Inclusion
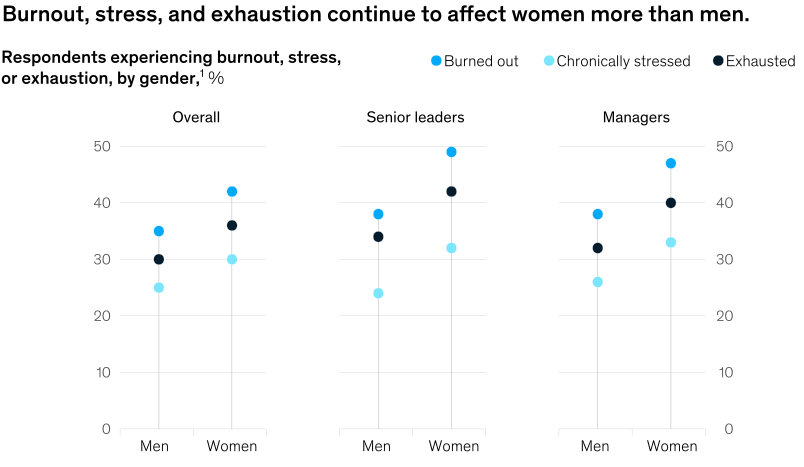
February 16, 2022 – Compared with men, senior women leaders report higher rates of burnout, chronic stress, and exhaustion. In this episode of The McKinsey Podcast, senior partners and leaders Alexis Krivkovich and Lareina Yee join Lucia Rahilly, global editorial director, to discuss some of the startling and hopeful results recently released in the Women in the Workplace 2021 report. Listen to the podcast directly below.

To listen to the podcast and see the transcript, see “The state of burnout for women in the workplace,” January 4, 2022.
customizer here
Visual form
Three-panel grouped comparison chart.
Layout / body structure
The chart is arranged as three side-by-side panels labeled overall, senior leaders, and managers. Reader moves panel by panel from left to right, comparing women and men within each panel across the same three burnout-related measures.
What is being compared
The chart compares women and men on burnout, chronic stress, and exhaustion, and it repeats that comparison for the full sample, senior leaders, and managers. It is a gender comparison nested inside a role-level comparison.
Measurement system
The measure is percent of respondents experiencing each condition, shown on a shared percentage scale that rises to 50. The visual relies on the same three outcome categories in every panel so the reader can compare both gender gaps and role-level intensity on the same footing.
Visible structure inside the graphic
Each panel places the women and men readings side by side under the three outcome labels, so the repeated structure makes it easy to see whether one gender consistently sits higher. The labels for burned out, chronically stressed, and exhausted are carried across the full chart, turning the page into a matrix of gender-by-role comparisons.
Main takeaway from the visual
Women report more burnout-related strain than men across the chart, and the gap does not disappear at the leadership level. The repetition of the same pattern in overall, senior-leader, and manager panels is what makes the chart feel systemic rather than anecdotal.
Key standout values or extremes
The percentage scale tops out at 50, and several women’s readings rise into the upper part of that range while the corresponding men’s readings sit lower. The strongest visual contrast comes from the persistent women-above-men pattern across all three panels instead of one isolated spike in only one role group.
Controls / sequence, when applicable
This is a static chart image with no in-chart controls to operate.
Companion media, when applicable
There is no separate companion audio or video; the chart image is the full visual on this page.