Source page: McKinsey & Company
Commentary
Work smarter not harder
Life Sciences | Capability building
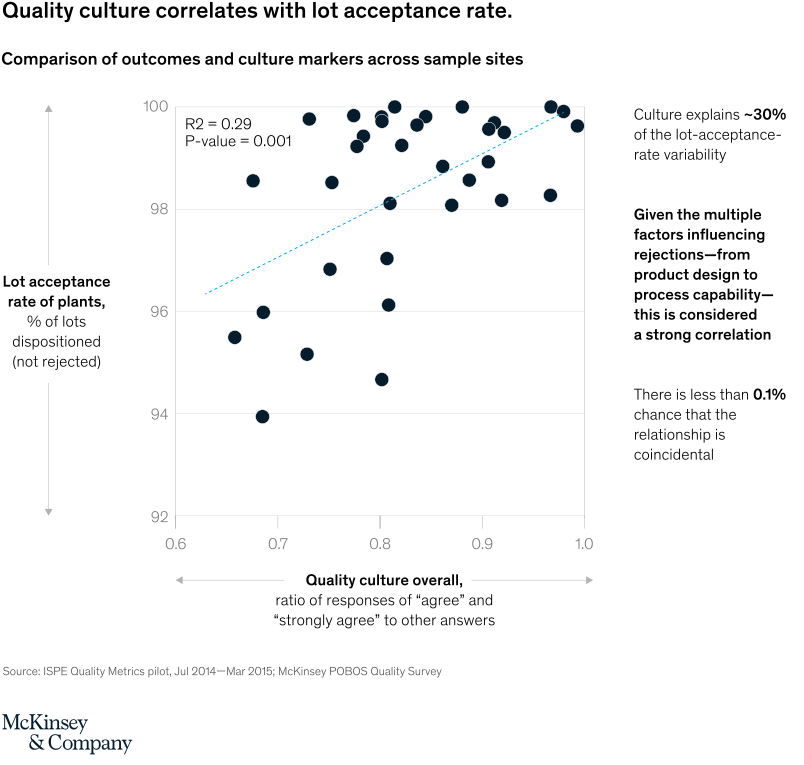
January 28, 2022 – Pharma and medtech companies that integrate a smart quality culture to their processes show high rates of lot acceptance, according to our global survey. A quality culture approach explains the 30 percent lot-acceptance-rate variability among 34 sampled plants.
To read the article, see “Embedding ‘smart quality’ culture and capabilities in the organization,” January 10, 2022.
customizer here
Visual form
Scatter plot with a fitted trend line and side annotations.
Layout / body structure
The page centers one scatter plot on the middle of the chart and places explanatory callouts to the right. Reader first reads the cloud of dots and the upward dashed line inside the chart area and then uses the right-hand notes to interpret how strong the relationship is.
What is being compared
The plot compares overall quality-culture scores across sample sites with lot acceptance rates at those plants. It is a site-by-site relationship between culture strength and manufacturing quality outcomes.
Measurement system
The horizontal axis runs from about 0.6 to 1.0 and measures the ratio of responses marked agree or strongly agree relative to other answers. The vertical axis runs from about 92 to 100 and measures the lot acceptance rate of plants, defined as the percent of lots dispositioned without rejection.
Visible structure inside the graphic
Dark dots mark individual sites across the plotting area, and a blue dashed regression line rises from lower left to upper right. The chart also prints R2 = 0.29 and P-value = 0.001 inside the plot, while the right-side text block adds two summary notes about the share of variability explained and the low probability that the relationship is coincidental.
Main takeaway from the visual
The chart shows a clear positive relationship: higher quality-culture scores are associated with higher lot acceptance rates. The dots do not form a perfect line, but the overall pattern slopes upward strongly enough that better culture is presented as a meaningful operational advantage.
Key standout values or extremes
The right-side notes state that culture explains about 30 percent of lot-acceptance-rate variability and that there is less than a 0.1 percent chance the relationship is coincidental. The lowest culture scores around 0.65 to 0.7 align with acceptance rates in the mid-90s, while many points near 0.9 to 1.0 sit close to 99 to 100 percent.
Controls / sequence, when applicable
This is a static chart image with no in-chart controls to operate.
Companion media, when applicable
There is no separate companion audio or video; the chart image is the full visual on this page.