Source page: McKinsey & Company
Commentary
Working parents’ worries go way beyond childcare when the pandemic closes schools
COVID-19 | Diversity & Inclusion | Parenting
December 14, 2020 – Parents are finding work more challenging than nonparents are—and it’s not just about childcare and homeschooling. They are feeling threats to their physical health, mental health, and job security.
To read the article, see “Diverse employees are struggling the most during COVID-19—here’s how companies can respond,” November 17, 2020.
customizer here
Visual form
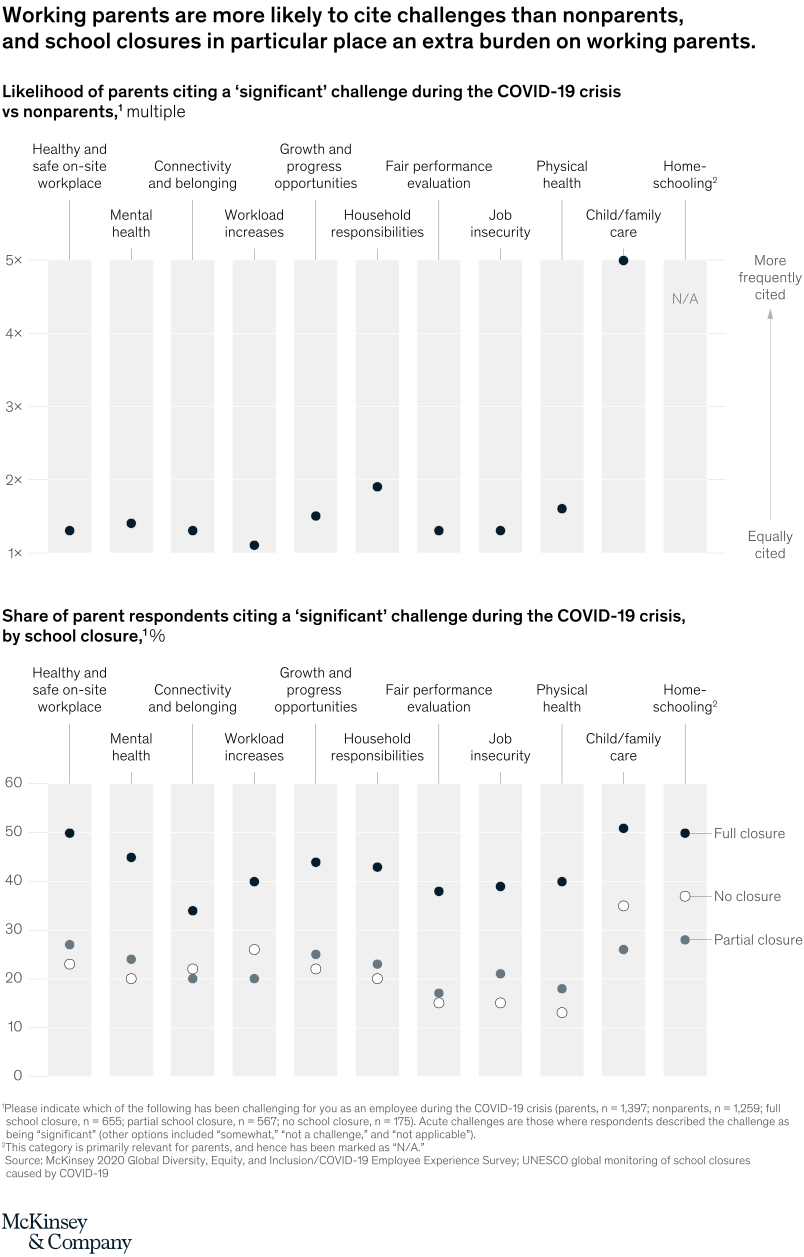
Two-panel dot comparison chart.
Layout / body structure
The chart is divided into an upper panel and a lower panel, both using the same challenge categories across the horizontal axis. Read the top panel first to compare how much more likely parents are than nonparents to cite each challenge, then move to the lower panel to compare parent responses by school-closure status.
What is being compared
The chart compares challenge reporting for parents versus nonparents during the COVID-19 crisis, and then compares parents experiencing full closure, partial closure, or no closure of schools. The categories include mental health, workload increases, growth opportunities, household responsibilities, job insecurity, physical health, child or family care, and home-schooling.
Measurement system
The top panel uses a multiplier scale from 1x to 5x, while the bottom panel uses share of parent respondents citing a significant challenge. The categories are plotted as individual dots against those shared vertical scales.
Visible structure inside the graphic
In the top panel, one dot per category sits against pale vertical guide blocks, with child or family care reaching the highest point near 5x and household responsibilities also standing clearly above the rest. In the lower panel, each category has three dots for full closure, no closure, and partial closure, and the dark full-closure dots sit highest for almost every category.
Main takeaway from the visual
Working parents report broader and heavier burdens than nonparents, and school closures intensify those pressures even further. The upper-panel multipliers and the lower-panel full-closure dots both climb highest in caregiving and home-schooling related categories, which makes the added load unmistakable.
Key standout values or extremes
In the top panel, child or family care is the clearest outlier at about 5x more frequently cited by parents, while household responsibilities sit close to 2x and most other categories cluster closer to 1x to 1.6x. In the bottom panel, full school closure pushes child or family care and home-schooling to roughly 50 percent of parent respondents, well above the partial-closure and no-closure points.
Controls / sequence, when applicable
This is a static chart image with no in-chart controls to operate.
Companion media, when applicable
There is no separate companion audio or video; the chart image is the full visual on this page.